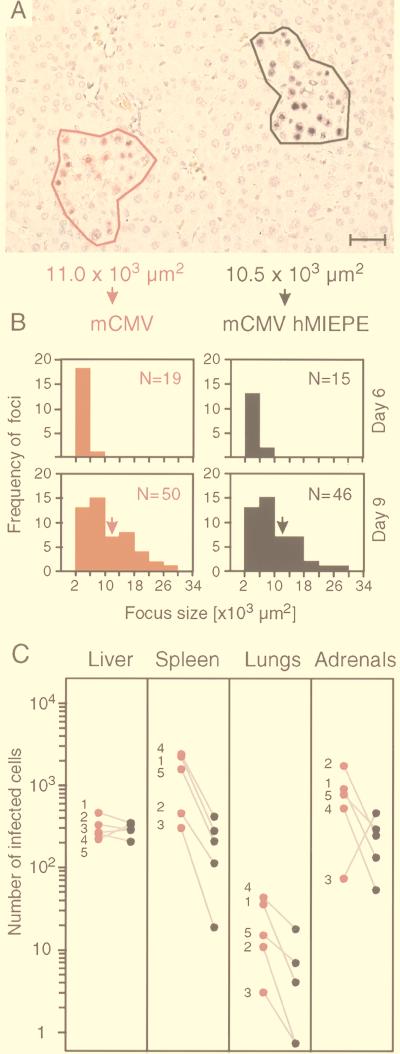
FIG. 6.
Quantitative analysis of virus growth in coinfected tissues. (A) Illustration of area morphometric analysis. MIEPE type-specific two-color ISH with hybridization probes mMIEPE-P (red staining) and hMIEPE-P (black staining) was employed to distinguish infectious foci caused by the viruses mCMV and mCMVhMIEPE, respectively, in liver parenchyma on day 9 after coinfection. Foci were circumscribed by a virtual line, and the area enclosed by the resulting polygon was calculated by using area morphometry software. The bar represents 40 μm. (B) Kinetics of virus growth in liver parenchyma. Results of area morphometric analyses performed on days 6 and 9 after coinfection are documented for representative 30-mm2 areas of tissue compiled from three livers per time point. Histograms represent the number of foci (ordinate) per classified focus size (abscissa) with size classes of 4,000 μm2. A threshold was set at 2,000 μm2, which represents ca. four hepatocytes. N, total number of foci within a 30-mm2 area of tissue. Arrows point to the size class of the particular foci shown in panel A. (C) Comparative quantitation of virus replication in the liver and at extrahepatic sites. The numbers of cells infected with mCMV (red) and mCMVhMIEPE (black) were determined on day 9 after coinfection for representative 10-mm2 areas of tissue sections derived from the organs indicated. In the case of adrenal glands, infected cells were counted for 2-mm2 areas, and the number was extrapolated to 10 mm2, whereas infected cells were counted for 10-mm2 areas in the case of the other organs. Shown are linked data pairs for mouse 1 through mouse 5 in order to document the variance between individual mice.

