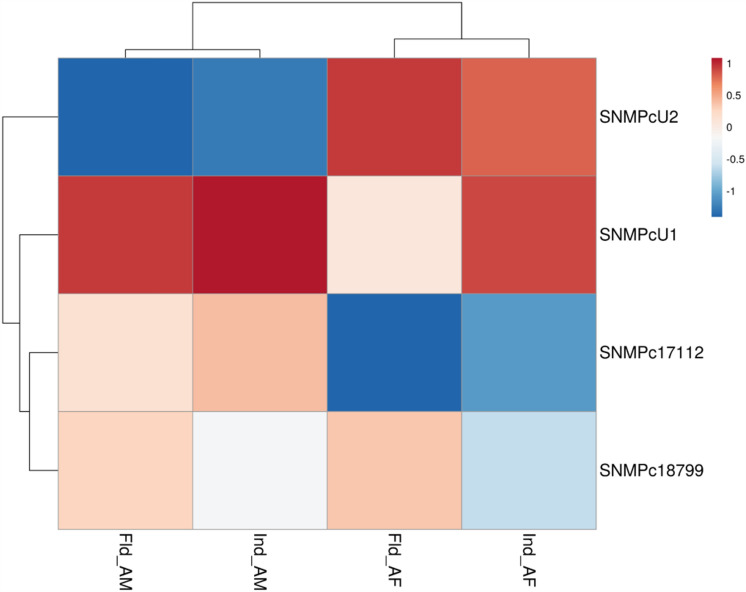
Figure 5.
Heatmap showing changes in RferSNMP expression levels in pre-exposed and field-collected RPW adults compared with the RferSNMP respective expression in nonexposed animals from the laboratory colony. The data represents log-transformed 2−ΔΔCT values measured by RT-qPCR. The heatmap colours represent the expression level from highest (blood red) to lowest (dark blue). Ind, insects pre-exposed with a commercial aggregation pheromone; Fld, insects collected from a date palm field in Saudi Arabia—AM, antenna male; and AF, antenna female.

