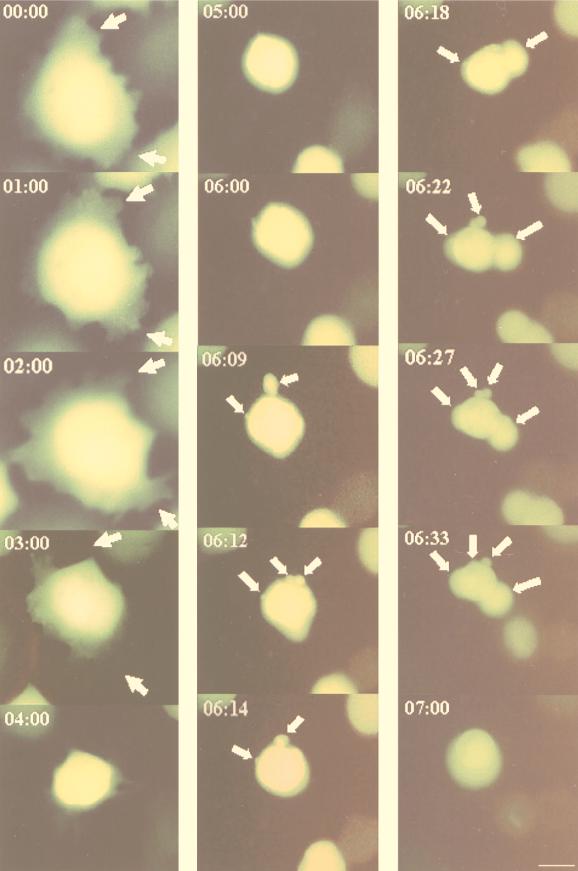
FIG. 1.
Dynamics of the sequential morphological changes visualized by EGFP in living cells infected with IPNV. Monolayer cultures of CHSE-214 cells were transfected with pEGFP-N1 by using Lipofectin and selected with G418. Cells were infected with virus (MOI of 1), and virus-infected cells were sequentially observed by fluorescence microscopy from 0 to 7 h p.i. Photographs were taken with a 40× objective. Scale bar, 3 μm. The arrows indicate the formation of MV from the apoptotic cell.

