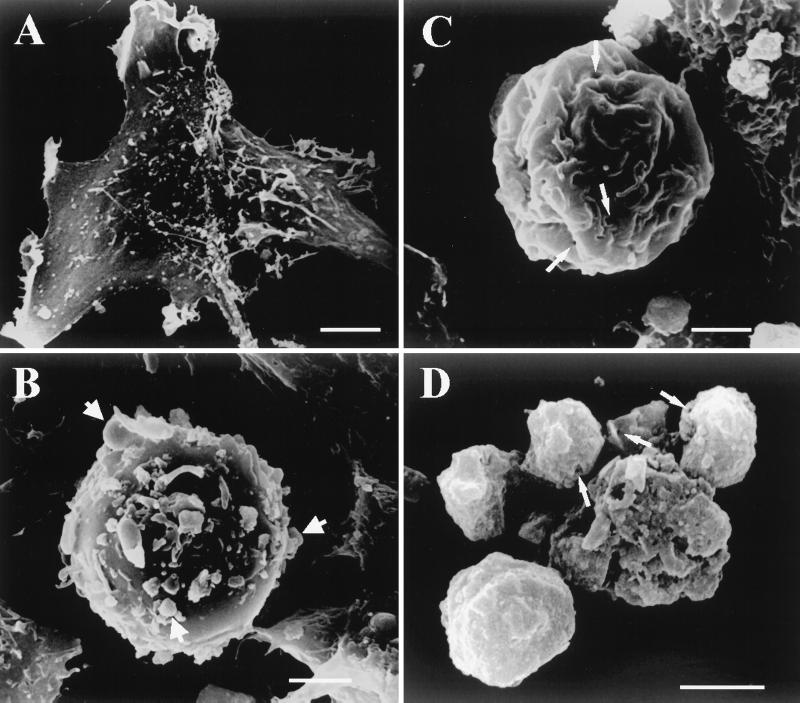
FIG. 3.
Scanning electron micrographs of CHSE-214 cells. (A) Negative control CHSE-214 cell. (B) Pre-late apoptotic CHSE-214 cell. The formation of MV from the apoptotic cell is indicated by arrows. (C) Middle-late apoptotic cell. The formation of small holes is indicated by arrows. (D) Late apoptotic cell. Small holes left on the surfaces of apoptotic bodies from the IPNV-treated group are indicated by arrows. Scale bar, 1.5 μm.

