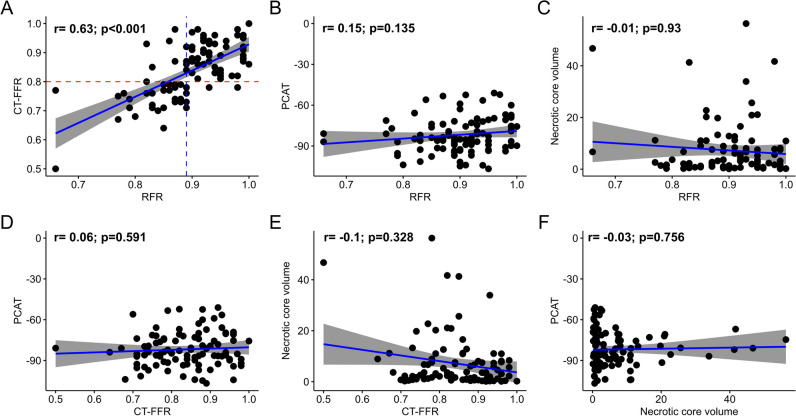
Fig. 2.
Correlation between CT-FFR, RFR, PCAT density, and necrotic core volume. Panels show a scatterplot for each variable with the coefficient correlation (r) derived from Spearman’s rho method, as appropriate. Correlation between RFR and CT-FFR (A), PCAT (B), and necrotic core volume (C). Correlation of CT-FFR with PCAT (D) and necrotic core volume (E). Correlation between necrotic core volume and PCAT (F). CT-FFR, fractional flow reserve derived from computed tomography angiography, diameter stenosis from computed tomography; PCAT, peri-coronary adipose tissue; RFR, resting full-cycle ratio

