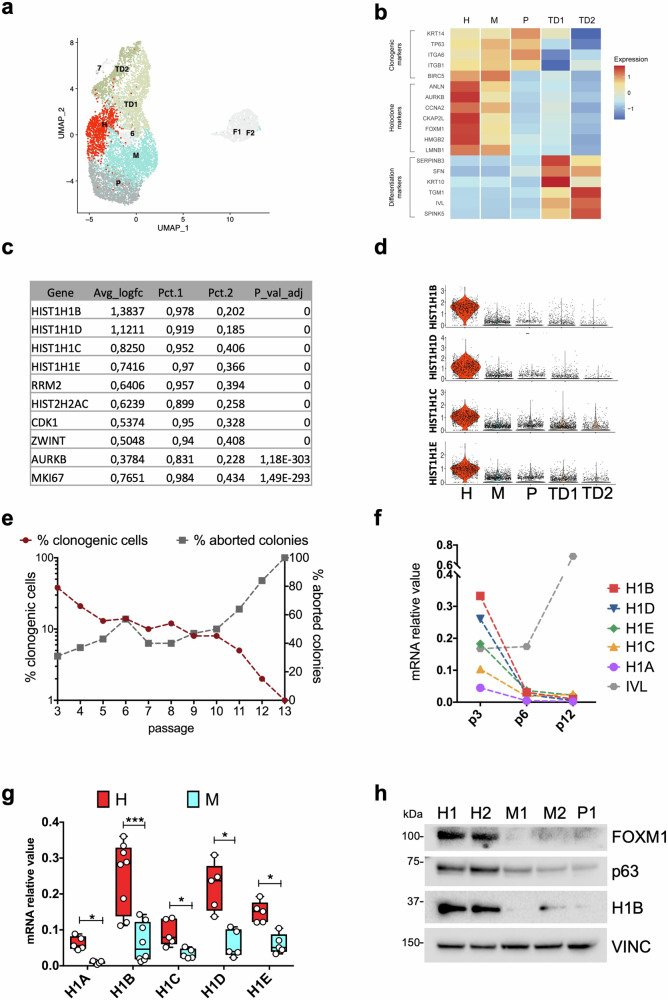
Fig. 1. Single-cell transcriptomic data reveal that H1B is mainly expressed in epidermal stem cells.
a Uniform manifold approximation and projection (UMAP) of the single cell RNA-seq dataset of 3.367 and 3.978 cells obtained from two sub-confluent primary epidermal cultures derived from independent healthy donors derived from Enzo et al. [21]. Keratinocyte clusters (H, M, P, TD1, TD2) are coloured according to cluster identity. Fibroblasts and low-quality clusters (F1 and F2, 6, 7) are shown in light grey. b Heatmap showing expression of clonogenic, holoclone, and differentiation markers used to annotate the five keratinocyte clusters. c Table showing the first ten most differentially expressed genes in H vs M clusters. d Violin plots showing the expression of HIST1H1B, HIST1H1D, HIST1H1C and HIST1H1E among the 5 clusters identified with scRNA-seq. e Serial cultivation of normal human keratinocytes (NHK). Percentage of clonogenic cells (dark red line) was calculated as the ratio between grown colonies and plated cells. Percentage of aborted colonies (grey line) was calculated as the ratio between the colonies scored as aborted and the number of clonogenic cells. f qRT-PCR quantification of the mRNA levels of five different H1 isoforms (H1A, H1B, H1C, H1D, H1E) and one differentiation marker (IVL) on NHK collected during serial cultivation. Expression levels were normalized per GAPDH. Data from one representative experiment are shown. g qRT-PCR quantification of the mRNA levels of five different H1 isoforms (H1A, H1B, H1C, H1D, H1E) on clones generate from at least two primary cultures. Expression levels were normalized per GAPDH. Holoclones and Meroclones are displayed in red and light blue, respectively. Data are presented as mean +/− SD, N = 5 different independent biological replicates, *P < 0.05, ***P < 0.001 Student t-test. h Western analysis of total cell extracts from cultures generated by holoclones (H1 and H2), meroclones (M1 and M2), and paraclone (P1) isolated by clonal analysis (see ‘Methods’) of sub-confluent NHK. Molecular weight indicators are shown.

