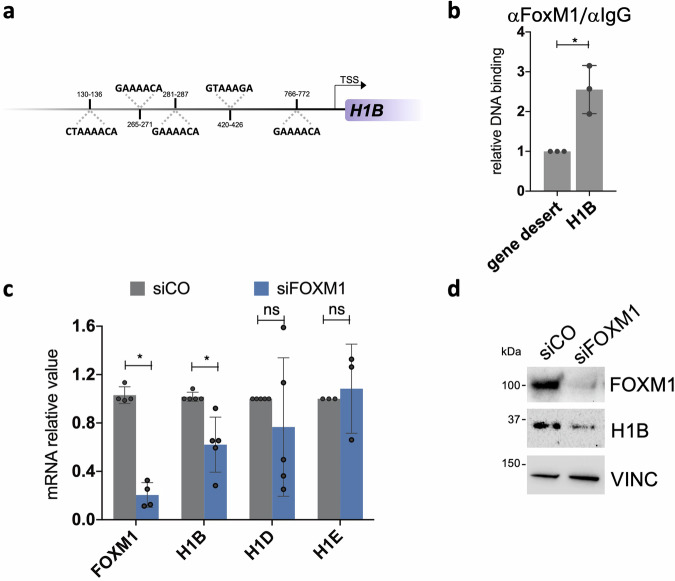
Fig. 2. FOXM1 controls the expression of H1B.
a Schematic representation of FOXM1 binding sites identified on H1B promoter. FOXM1 binding sites positions, and the corresponding sequences are shown. b ChIP-qPCR showing FOXM1 binding to the indicated sites in human primary keratinocytes. Relative DNA binding was calculated as a fraction of input and normalized with the negative region (gene desert, see Supplementary Table 4) arbitrarily set to 1, N = 3 independent experiments. *P < 0.05, Student t-test. c qRT-PCR quantification of the mRNA levels of FOXM1 and H1B, H1D and H1E on cells derived from NHK cultures transfected with indicated siRNAs. Expression levels were normalized per GAPDH and given relative to the control (siCO) arbitrarily set to 1. Data are presented as mean +/− SD, N = at least 3 different independent biological replicates, *P < 0.05, Student t-test. d Western analysis on total cell extracts from cultures generated by NHK transfected with indicated siRNAs.

