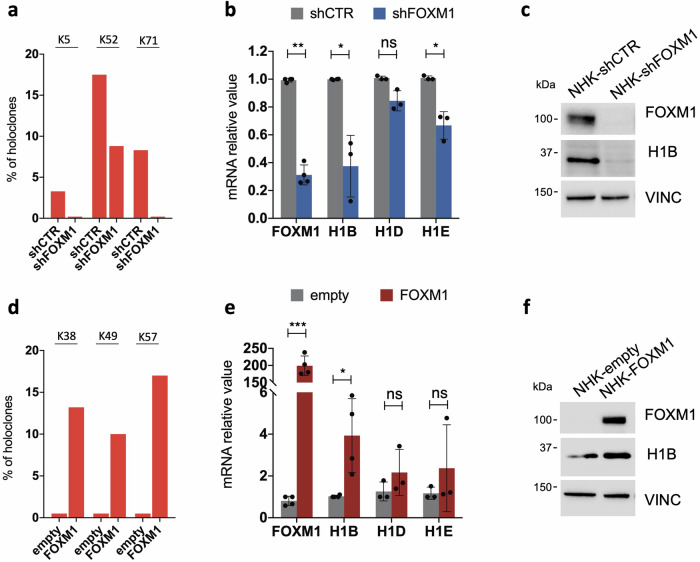
Fig. 3. H1B expression correlates with the amount of epidermal stem cells.
a Percentage of holoclones derived from 3 normal human keratinocytes cultures (NHK) [20] transduced with a lentiviral vector carrying a control shRNA (shCTR) or a shRNA targeting FOXM1 (shFOXM1). b qRT-PCR quantification of the mRNA levels of FOXM1, H1B, H1D, H1E on cells derived from NHK cultures transduced with a lentiviral vector carrying the indicated shRNA. Expression levels are normalized per GAPDH. Data are presented as mean +/− SD, N = at least 3 different independent biological replicates, *P < 0.05, **P < 0.01 Student t-test, ns = not significant. c Western analysis on total cell extract derived from NHK cultures transduced with lentiviral vectors carrying the indicated shRNAs. d Percentage of holoclones derived from 3 NHK cultures (see ‘Methods’) transduced with a lentiviral vector carrying an empty backbone as control (empty) or FOXM1 cDNA for FOXM1 overexpression (FOXM1). e qRT-PCR quantification of the mRNA levels of FOXM1, H1B, H1D, H1E on cells derived from FOXM1- (FOXM1) or empty backbone-transduced (empty) NHK cultures. Expression levels were normalized per GAPDH. Data are presented as mean +/− SD, N = at least 3 different independent biological replicates, *P < 0.05, ***P < 0.001 Student t-test, ns = not significant. f Western analysis on total cell extract derived from FOXM1- (FOXM1) or empty backbone-transduced (empty) NHK cultures. FOXM1 endogenous level in NHK-empty is not detectable due to technical reason. Molecular weight indicators are shown.

