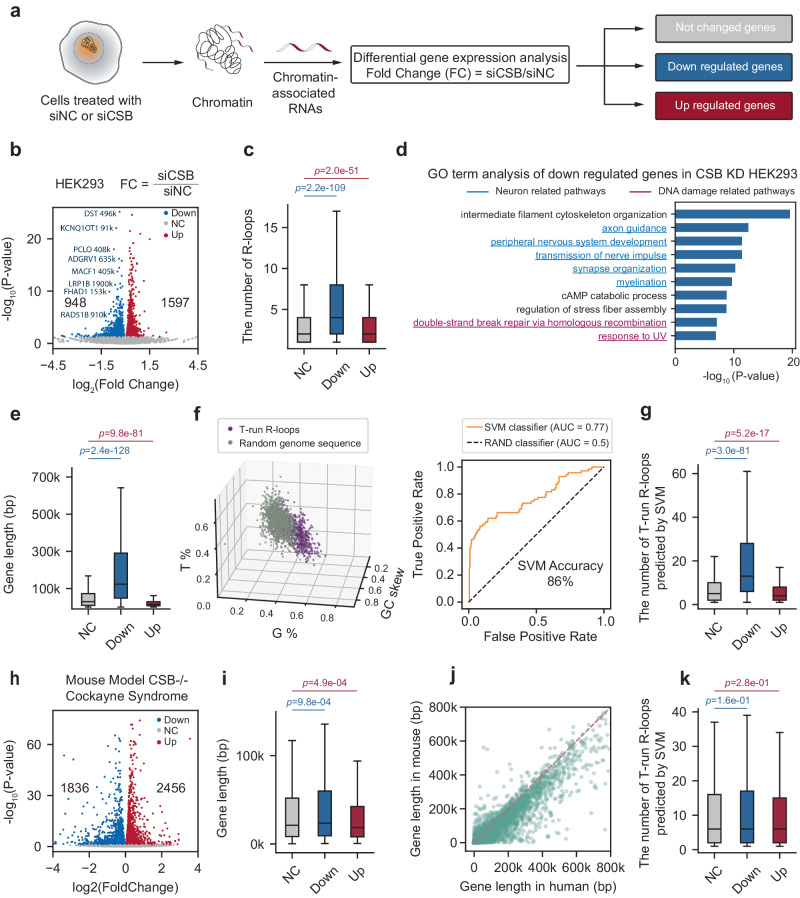
Fig. 5. T-run-associated R-loops are enriched in long genes regulated by CSB.
a Diagram for chromatin-associated RNA-seq to detect the impact of CSB depletion on transcription. b Volcano plot showing differential gene expression based on RNA-seq analysis of chromatin-associated RNAs in siNC and siCSB-treated HEK293 cells. c Distribution of the number of R-loops in no change, downregulated and upregulated gene sets. d GO term analysis of downregulated genes identified from RNA-seq analysis of chromatin-associated RNAs in siNC and siCSB-treated HEK293 cells. e Distribution of gene length in no change, downregulated and upregulated gene sets. f 3D scatter plot (left) of three sequence features (G%, T%, and GC skew) with colors representing T-run associated R-loops (purple) and randomly selected sequences across the genome (gray). ROC curves (right) for the SVM classifier on T-run associated R-loops and random genomic sequences. g Distribution of the number of predicted T-run-associated R-loops within each gene in no change, downregulated and upregulated gene sets. h Volcano plot of differential gene expression in the kidney of WT and CSB KO mice. i Distribution of mouse gene length in no change, downregulated and upregulated mouse gene sets. j Scatter plot showing gene length difference between mouse (Y-axis) and human (X-axis) genomes. Each dot represents a conserved gene. k Distribution of the number of predicted T-run-associated R-loops within each mouse gene in no change, downregulated and upregulated mouse gene sets. For the box plot, the center line represents the median, while the upper and lower edges indicate the interquartile range. The whiskers extend to 1.5 times the interquartile range. Statistical significance was assessed using a two-tailed Mann–Whitney U-test. n = 25148, 948, 1957 for unchanged, downregulated, and upregulated genes in plots (c, e, g), and n = 15415, 1836, 2456 for unchanged, downregulated, and upregulated genes in plots (i, k).

