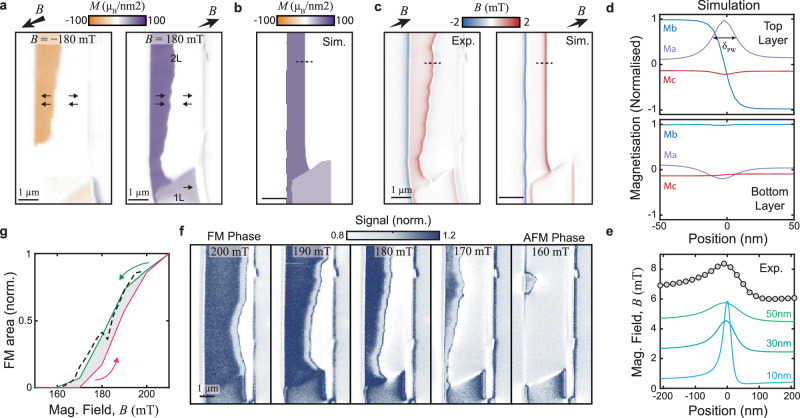
Fig. 2. Imaging the spin–flip transition in bilayer CrSBr.
a Image of coexisting regions of AFM and fully magnetized phases in a CrSBr bilayer obtained at ∣Bext∣ = ± 180mT after demagnetizing the sample from higher fields, with a magnetic field axis oriented along (θ, ϕ) = (53°, 16°) (see text). The images were obtained by magnetization reconstruction from raw ∣BNV∣ data. b Micromagnetic simulation of the phase wall (PW) under the same conditions as the right panel in (a). c Experimental magnetic field image from the measurement in (a) and simulated magnetic field from (b). d Cross sections of the magnetization vector across the PW (dashed line in b) for both the top and bottom layers. e Comparison of the experimental measured magnetic field line cut across the PW (dashed lines in c) and the simulation with various NV-sample standoff distances, offset for clarity. f Qualitative NV magnetometry images of the movement of the PW when demagnetizing the sample from the fully magnetized to the AFM state. g Magnetic hysteresis of the bilayer sample, calculated as a ratio of the total area in the fully magnetized state versus the AFM state. The dashed line corresponds to data from an additional measurement run.

