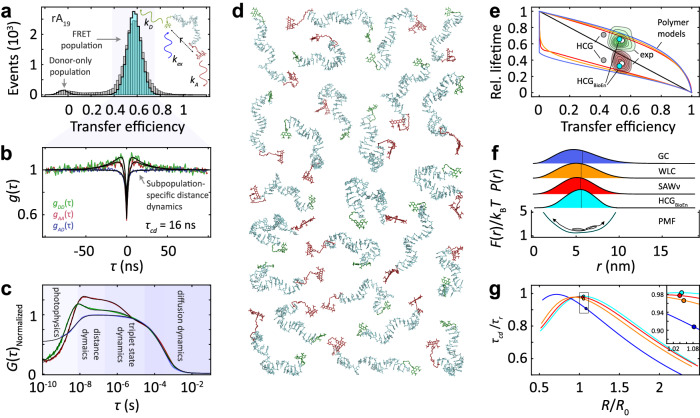
Fig. 1. Quantifying chain reconfiguration dynamics of single-stranded nucleic acids (illustrated for rA19).
a Transfer efficiency histogram of freely diffusing terminally labeled rA19 at 150 mM NaCl in 10 mM HEPES pH 7, with the FRET-active population at E ≈ 0.55 and the donor-only population at E ≈ 0 from molecules with inactive acceptor (gray: measured; black line and cyan shading: shot noise-limited photon distribution analysis57) with an inset of a schematic representation of FRET on ssNA. b Normalized nsFCS of the FRET subpopulation shaded in panel a with donor (green) and acceptor (red) fluorescence autocorrelations and donor-acceptor crosscorrelation (blue; black lines: fits with Eq. 12 (SI Methods), with resulting fluorescence correlation time, τcd). c Normalized subpopulation-specific complete correlation functions (black lines: global fits with Eq. 11). d Representative structures from the HCG ensemble of rA19 with explicit donor and acceptor dyes, Alexa Fluors 488 (green) and 594 (red). e Distributions of relative donor (green contours) and acceptor fluorescence lifetimes (red contours) versus transfer efficiency8 for all detected bursts (white points: average lifetimes and efficiencies). The straight line shows the theoretical dependence for fluorophores at a fixed distance (static line); curved lines show the dependences for dynamic systems based on analytical polymer models: Gaussian chain8 (GC, blue), worm-like chain5,8 (WLC, orange), modified self-avoiding walk polymer8,63 (SAW-ν, red); upper lines, donor lifetime; lower lines, acceptor lifetime. Gray (HCG) and cyan dots (HCGBioEn) show the values from the HCG ensemble and the reweighted ensemble of rA19, respectively. f Dye-to-dye distance distributions inferred from the mean and variance of the transfer efficiency distributions of rA19 for the polymer models and the HCGBioEn ensemble (cyan), with root mean square end-to-end distances, R, indicated as vertical lines, and the potential of mean force (PMF) for the HCGBioEn ensemble (SI/Methods). g Ratio of fluorescence correlation time () and chain reconfiguration time ) (SI Methods) as a function of R/R0, for the different models (circles: values for distance distributions in f; R0: Förster radius). Source data are provided as a Source Data file.

