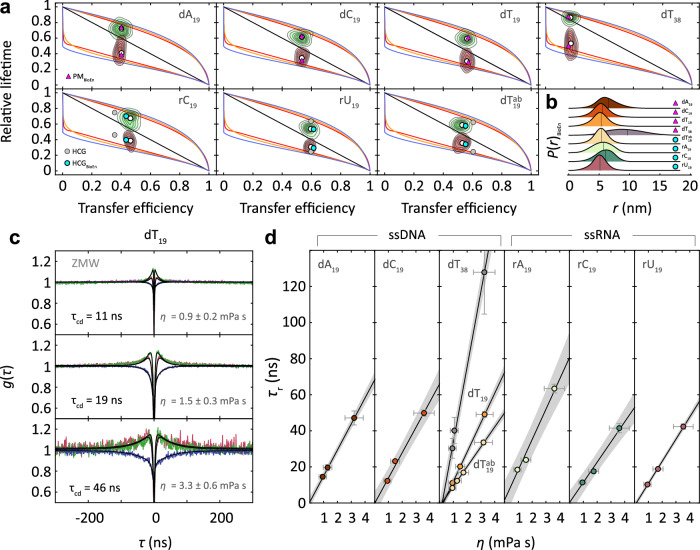
Fig. 2. Sequence dependence of chain dynamics and internal friction in single-stranded nucleic acids.
a Distributions of relative donor (green contours) and acceptor fluorescence lifetimes (red contours) versus transfer efficiency of ssDNA and ssRNA from all detected fluorescence bursts (white points: average lifetime and efficiency) compared with predictions from analytical polymer models (analogous to Fig. 1e), the HCG (gray) and HCGBioEn ensembles (cyan) for ssRNA and the reweighted polymer models (PMBioEn: purple triangles) for the ssDNA. b Dye-to-dye distance distributions from HCGBioEn ensembles (cyan) and reweighted polymer models (purple triangles) with root mean square end-to-end distance, R, indicated as vertical lines. c Representative normalized subpopulation-specific nsFCS measurements (color code as in Fig. 1) for dT19 at different viscosities (uncertainties correspond to standard deviations of the solvent viscosities estimated from diffusion times using a calibration curve derived from FCS measurements, see Methods) with fluorescence correlation times, τcd (black lines, global fits; see Methods). d Solvent viscosity (η) dependence of chain reconfiguration times, τr, of ssNAs (color code according to distance distributions as shown in b) with linear fits (shaded bands: 95% confidence intervals). Values and error bars for at the viscosity of water are the mean and standard deviation, respectively, from three independent measurements. Values and error bars for at higher viscosities represent means and standard deviations from the values obtained based on four different distance distributions (GC, WLC, SAW-ν, HCGBioEn). Source data are provided as a Source Data file.

