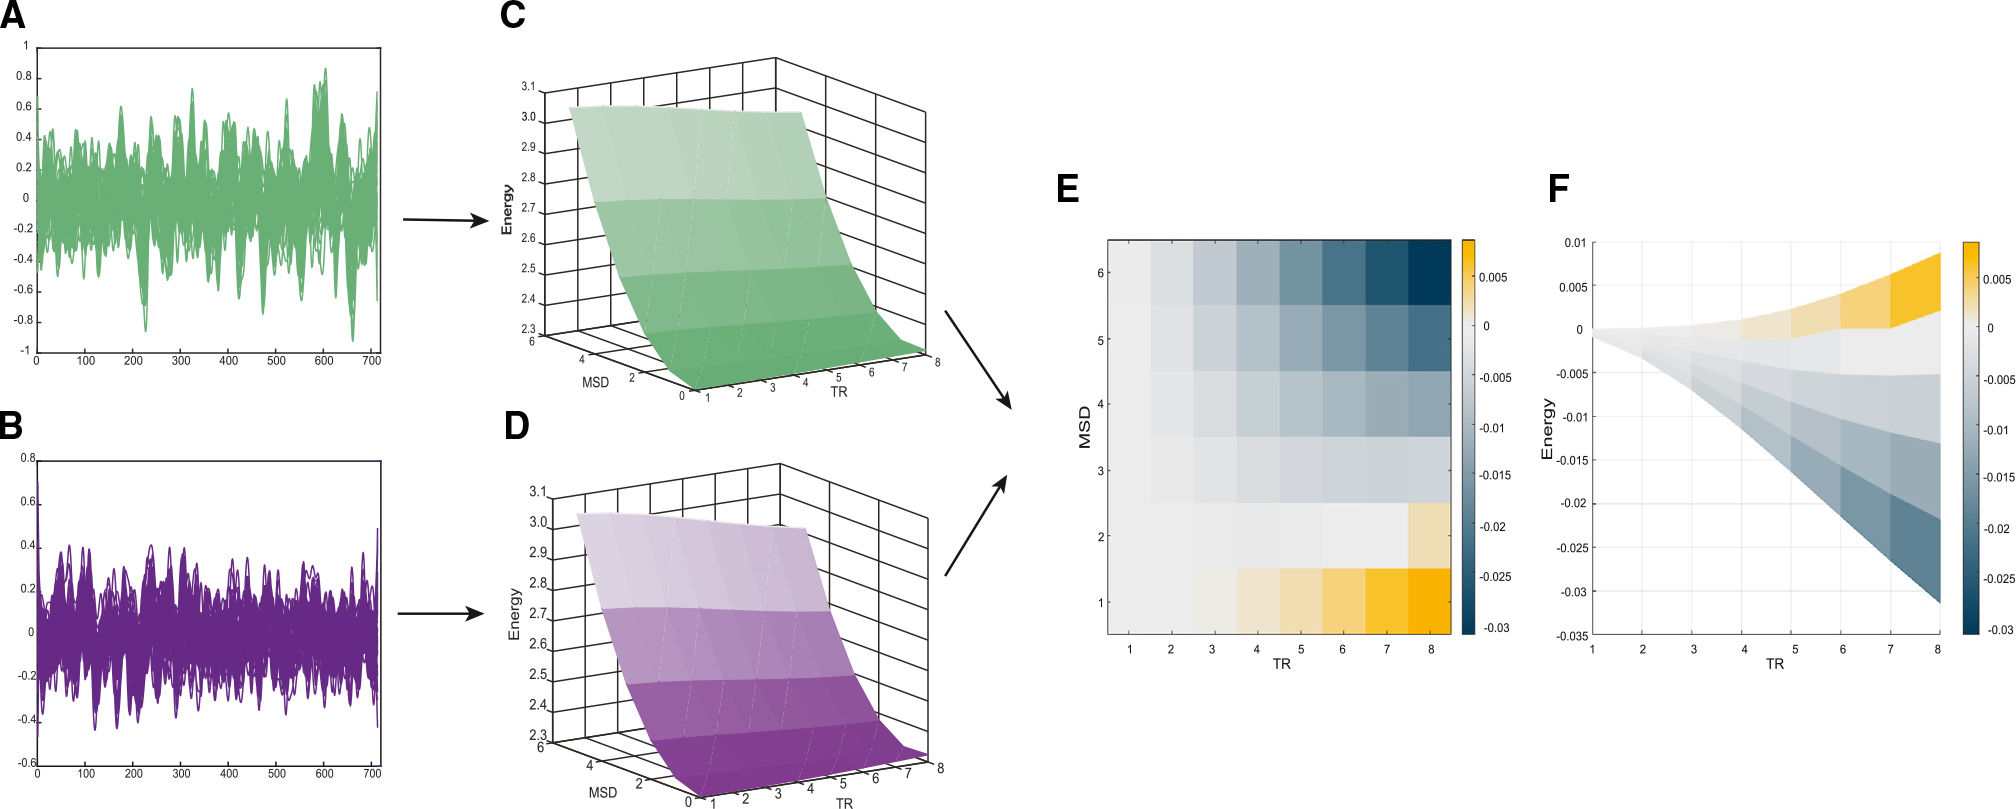
Figure 2. Lesions of the cholinergic nbM lead to energy landscape flattening.

(A) Plot of an example time series across control sessions for both monkeys for 50 regions.
(B) Plot of an example time series across inhibition sessions for both monkeys for 50 regions.
(C) Plot of the average (both monkeys) attractor landscape (changes in fMRI signal activity being measured in relation to MSD value and time represented by TRs) during no inhibition.
(D) Plot of the average (both monkeys) attractor landscape (changes in fMRI signal activity being measured in relation to MSD value and time represented by TRs) during nbM inhibition.
(E) 2D plot of the average difference (of both monkeys) in attractor landscape (changes in fMRI signal activity being measured in relation to MSD value and time represented by TRs) between the nbM being inhibited vs. no inhibition; significantly (p < 0.05, paired t test) different MSD energy values are represented on the colored 2D plot beneath the difference in the attractor plot.
(F) 2D plot of the average difference (both monkeys) in attractor landscape between the nbM inhibition versus no inhibition; energy is represented on the y axis, with the time represented on the x axis (across all MSD). Differences in MSD energy are represented on the color bar.
