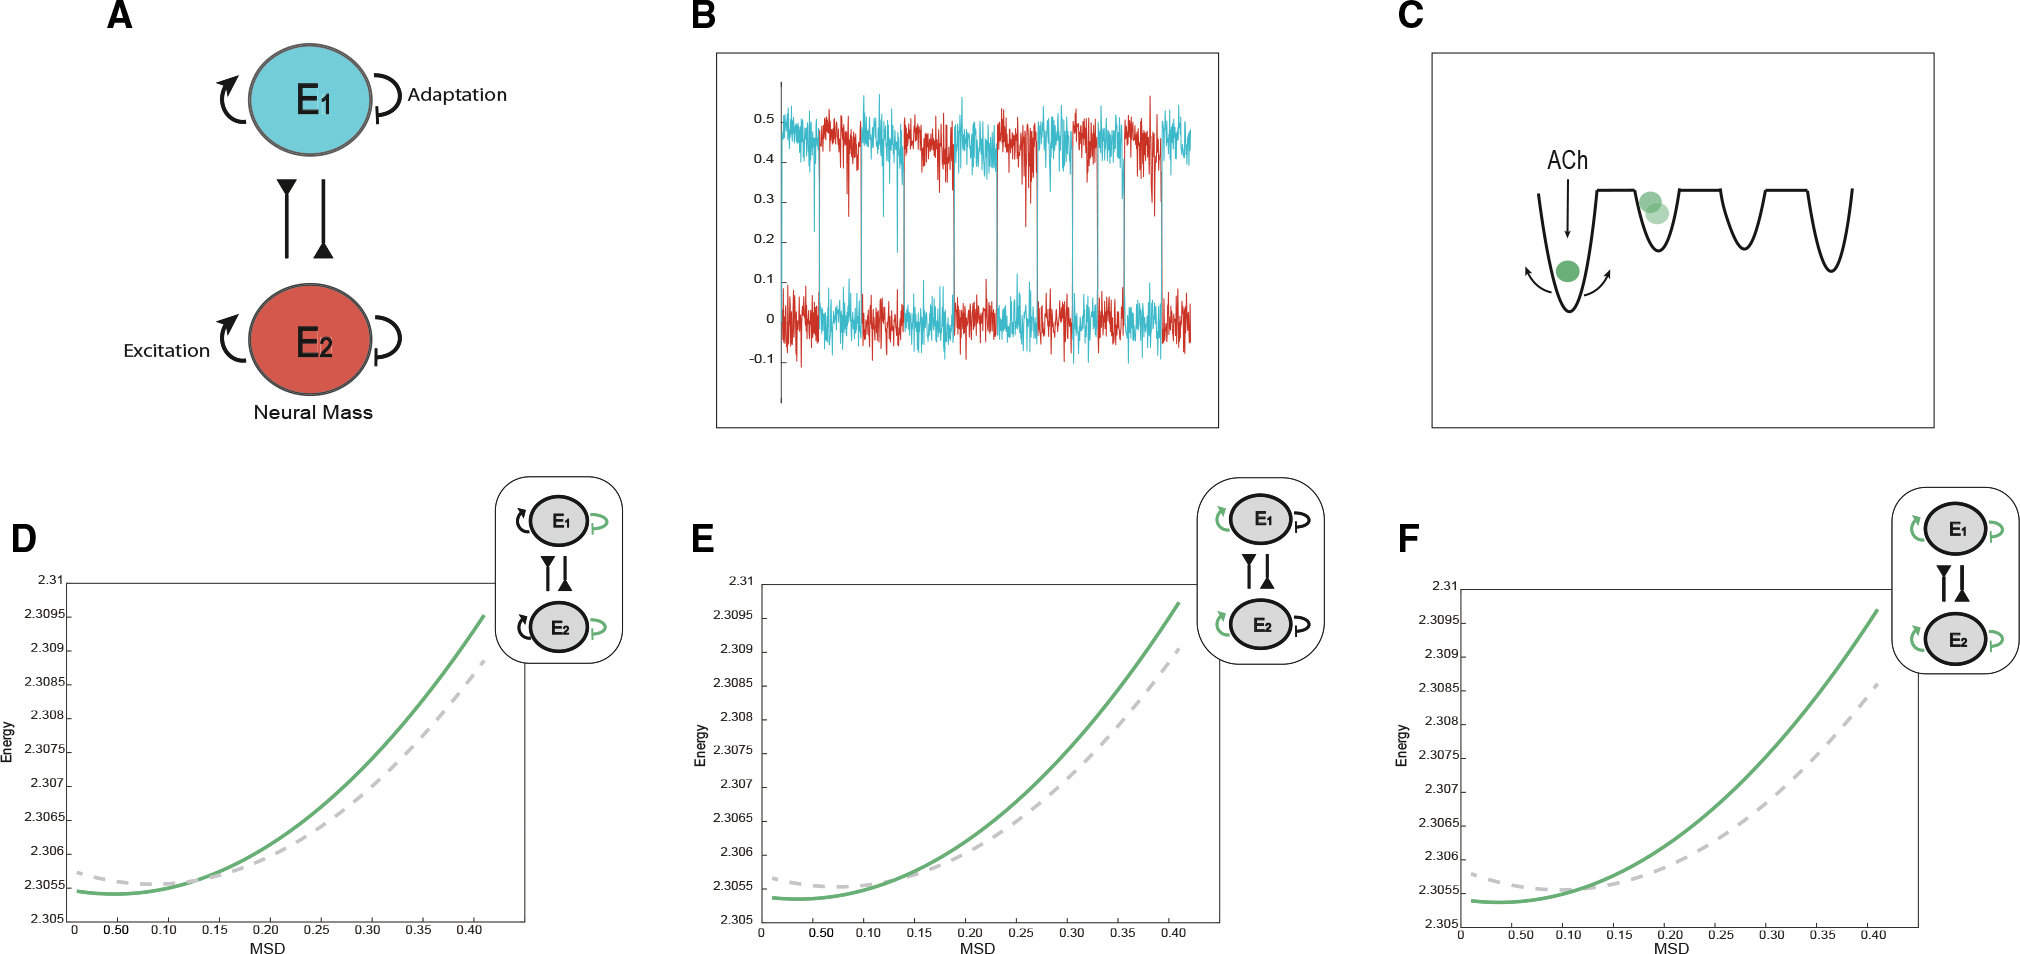
Figure 4. Computational evidence for cholinergic deepening of attractor wells.

(A) Graphical representation of the neural mass model with adaptation manipulation.
(B) Plot of the down-sampled time series of the two neural mass populations.
(C) Graphical representation of role of the cholinergic system in facilitating deepened attractor landscapes.
(D) A plot of attractor landscape averaged across time as adaptation is decreased (the dashed line represents d = 0.25, and green represents d = 0.05).
(E) A plot of attractor landscape averaged across time as excitability is increased (the dashed line represents a = 0.9, and green represents a = 1.1).
(F) A plot of attractor landscape averaged across time as excitability is increased and adaptation is decreased (the dashed line represents a = 0.9, d = 0.25, and green represents a = 1.1, d = 0.05).
