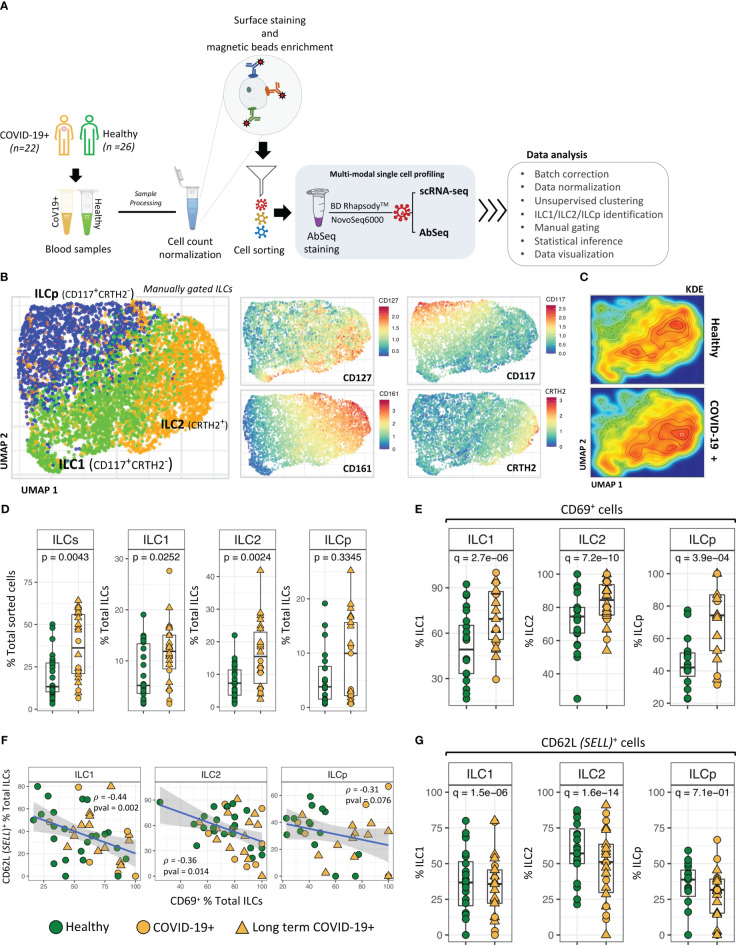
Figure 1.
ILC identification and classification. (A) Schematic illustrating experimental approach. (B) UMAP dimensionality reduction analysis of manually gated ILCs from COVID-19 patients and healthy control participants. ILCs in UMAPs are colored to show the relative expression of CD127, CD161, CD117 and CRTH2. (C) Kernel Density Estimation (KDE) of ILC distribution in the UMAPs. The plot represents the density distribution of ILCs from COVID-19 patients and healthy controls. (D) Frequencies (i.e., percentage of total live cells) of ILCs and ILC subsets from COVID-19 patients were compared with healthy controls. P-values between two groups of samples were calculated using Wilcoxon rank-sum test. (E) Significant differences in CD69 expression by ILC subsets from COVID-19 patients compared with healthy controls. (F) Regression analysis showing the inverse association between CD62L+ ILCs versus CD69+ ILCs in each sample. (G) Frequencies (i.e., percentage) of CD62L+ ILCs from COVID-19 versus healthy controls. Adjusted p-values between two groups of cells were calculated using Wilcoxon rank-sum test (see methods). For boxplot representation, percentage of cells expressing a given protein in every sample is shown.

