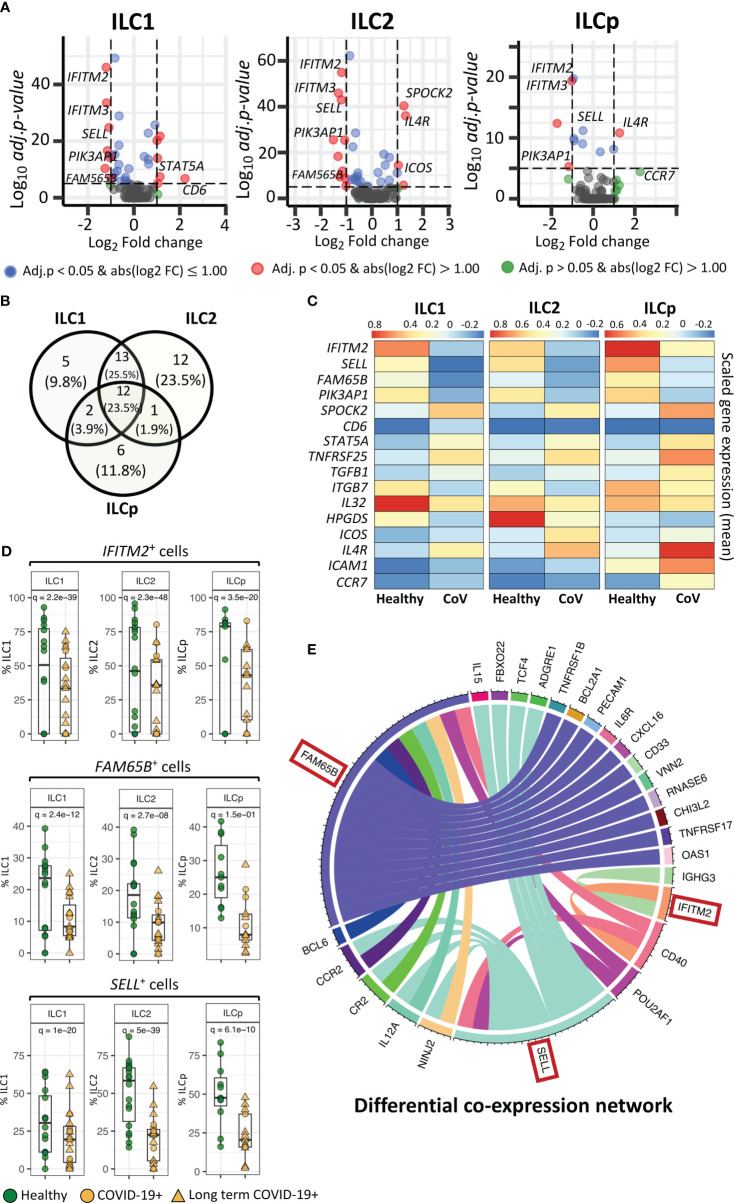
Figure 2.
Genes differentially expressed in ILCs from COVID-19 patients compared with healthy controls. (A) Volcano plots representing DE transcripts in sorted ILCs from COVID-19 patients and controls. (B) Venn diagram showing the number of DE genes in each ILC subset. We observed 13 DE genes common to all three ILC subsets from COVID-19 patients relative to healthy controls. (C) Heatmap depicting mean (scaled) expression of selected DE genes in COVID-19 patients and healthy controls in each ILC subset. (D) Frequencies (i.e., percentage) of IFITM2 +, FM65B + and SELL + ILCs from COVID-19 patients versus healthy controls. (E). The circos plots representing differential co-expression networks reconstructed for IFITM2, FM65B and SELL genes in total ILC population. The edges in the plot represents co-expression links significantly different across healthy vs COVID-19 ILCs. We observed that among IFITM2, FM65B and SELL genes, FAM65 shows highest degree of differentially co-expressed links with other genes. Adjusted p-values for enumerating DE genes between two groups of cells were calculated using MAST test (see methods). For boxplot representation, percentage of cells expressing the given gene in every sample is shown.

