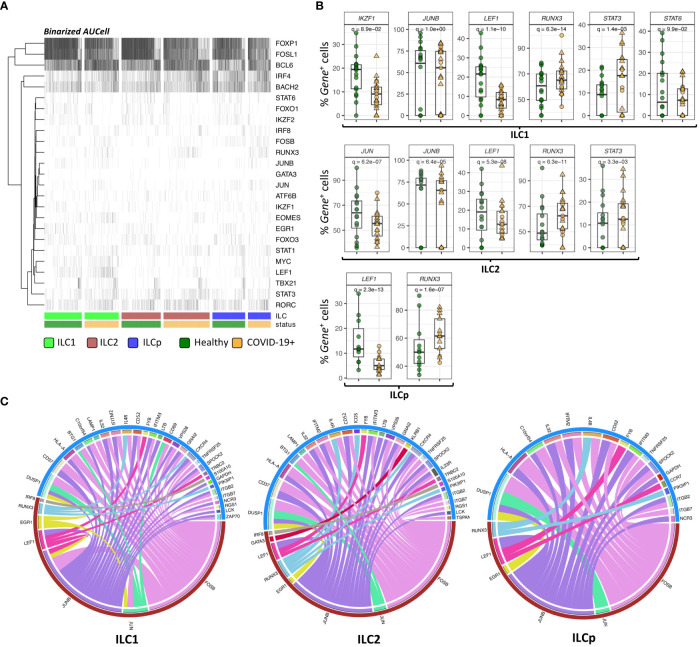
Figure 4.
SCENIC analysis of regulon identification. (A) Heatmap depicting the binarized AUcell scores of 25 different TFs in ILC1, ILC2 and ILCp. The row represents TFs (regulons) and column represents ILCs. The ILCs are annotated as per the color bars in the bottom panels of the heatmap. (B) Boxplots of selected TF genes with statistically significant differential expression. The y-axis represents the percentage of cells expressing a given TF in each sample. The p-values were calculated by comparing the scaled gene expression profile in two groups of ILCs (COVID vs healthy control) using Seurat R package (test used: MAST) at the single cell level. (C) The circos plots representing reconstructed gene regulatory networks between TFs and their targets predicted in ILC1, ILC2 and ILCp cells. The red arc represents the known TFs and blue arc represents differentially expressed target genes. The edges in the plot represents regulatory interactions between TF and their target genes significantly differentially expressed across healthy vs COVID-19 ILCs. Adjusted p-values for enumerating DE genes between two groups of cells were calculated using MAST test (see methods). For boxplot representation, percentage of cells expressing the given TF gene in every sample is shown.

