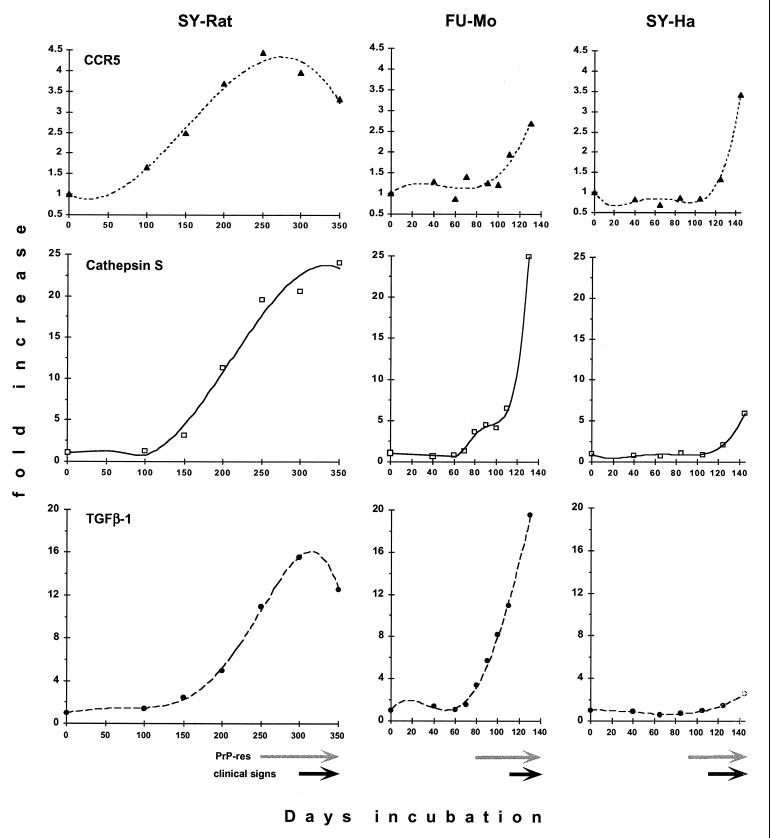
FIG. 4.
Quantitative analysis of Northern blot transcripts showing marked differences between models. Each time point represents a pooled RNA sample from two animal brains. CCR5 (upper row, solid triangles), cathepsin S (middle row, open squares), and TGF-β1 (lower row, solid circles) are shown in the SY-Rat, FU-Mo, and SY-Ha models of CJD. Values are normalized to levels of GAPDH mRNA and expressed in terms of the fold increase over the corresponding normal brain sample (indicated here as day 0). The curve fits shown for mRNA increases all have r2 values greater than 0.977, except for CCR5 expression in the FU-Mo model (r2 = 0.896). Note the different scales for the expression levels of the three transcripts. PrP-res levels and clinical signs were assessed with the same animals used for these RNA studies. The onset of major PrP-res accumulation is indicated by gray arrows, and the durations of clinical symptoms are indicated by black arrows as previously documented in the SY-Rat and SY-Ha models (35, 36), with PrP-res increasing ∼20-fold after 200 days in SY-Rat infection and >30-fold after 87 days in SY-Ha infection. Figure 5 documents the major deposition of PrP amyloid in the FU-Mo model after 80 days.

