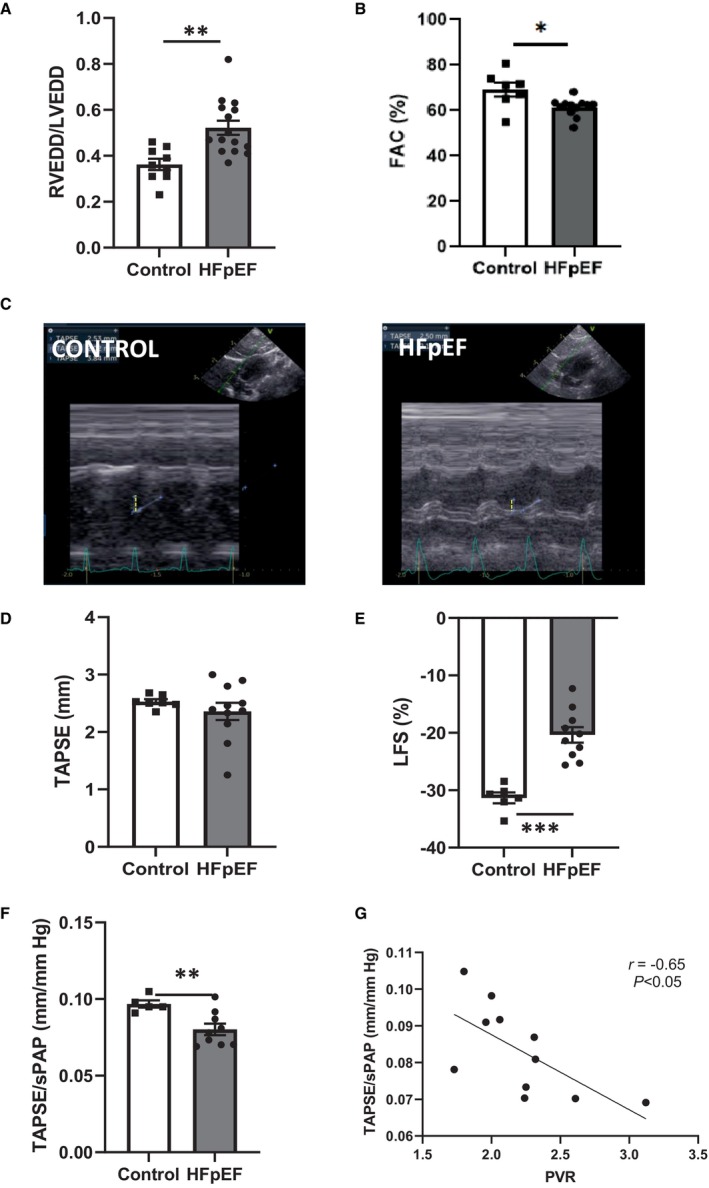
Figure 4. Echocardiographic evaluation of RV structure and function in HFpEF rats.

RV enlargement, defined by the ratio of RVEDD and LVEDD A) and RV systolic function, measured as the fractional area change (in %; B), the tricuspid annular plane systolic excursion (TAPSE; in mm; D), as well as representative echocardiographic images (C) derived from control (left panel) and HFpEF rats (right panel) and the RV free wall LFS (in %; E) in control (white bars; n=9) and HFpEF (black bars; n=13) rats. Right ventricule–pulmonary artery coupling, assessed as the TAPSE‐to‐sPAP ratio (F) in control (white bars; n=9) and HFpEF (black bars; n=13) rats. Correlation between TAPSE‐to‐sPAP ratio and PVR (G). Values are expressed as mean±SEM. * 0.01<P<0.05, ** 0.001<P<0.01, *** 0.001>P HFpEF vs control rats. HFpEF indicates heart failure with preserved ejection fraction; LFS, longitudinal fractional shortening; LVEDD, left ventricular end‐diastolic diameter; PVR, pulmonary vascular resistance; RV, right ventricular; RVEDD, right ventricular end‐diastolic diameter; sPAP, systolic pulmonary artery pressure; and TAPSE, tricuspid annular plane systolic excursion.
