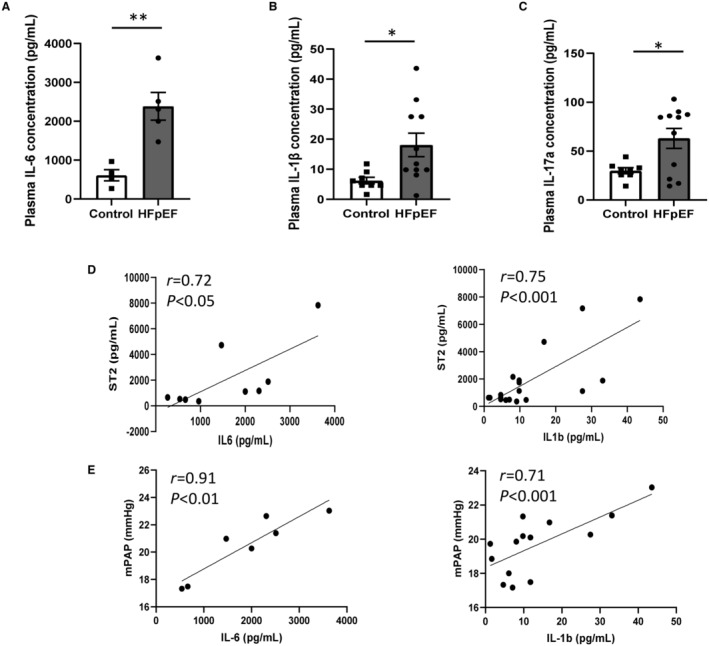
Figure 6. Circulating plasma levels of proinflammatory cytokines.

Plasma levels of IL‐6 (A), IL‐1β (B) and IL‐17a (C) in HFpEF (black bars; n=13) vs control (white bars; n=9) rats. Values are presented as mean±SEM. * 0.01<P<0.05, **0.001<P<0.01, HFpEF vs control rats. Correlations between plasma levels of cardiac biomarker sST2 and plasma levels of pro‐inflammatory cytokines, including IL‐6 and IL‐1β (D) and between hemodynamic parameter, mPAP and plasma levels of proinflammatory cytokines, including IL‐6 and IL‐1β (E). Data of HFpEF and control groups were analyzed together using a parametric Pearson's correlation coefficient analysis. HFpEF indicates heart failure with preserved ejection fraction; IL, interleukin; mPAP, mean pulmonary artery pressure.
