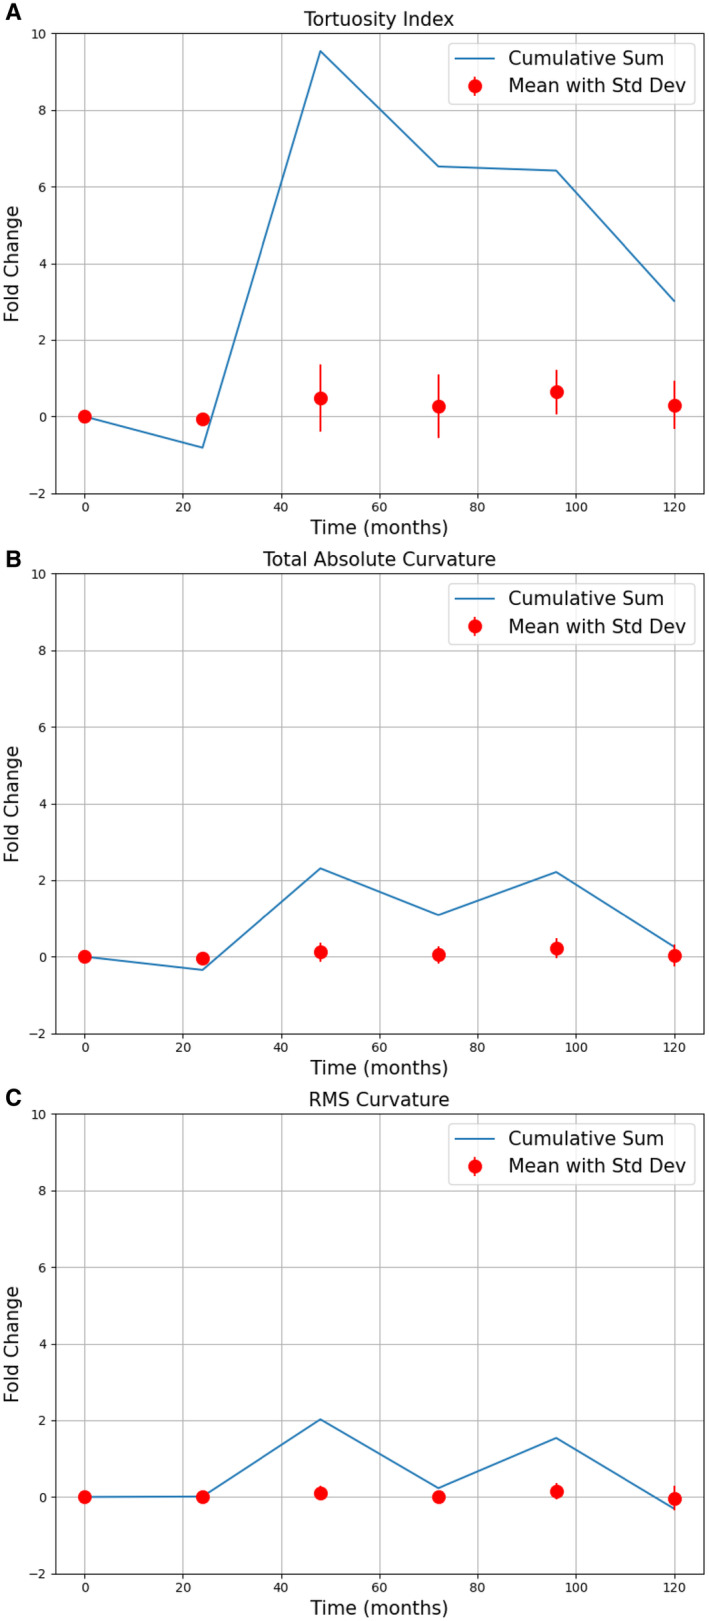
Figure 3. Change in tortuosity from baseline over 10 years of follow‐up.

Primary data were processed with a 24‐month moving average filter. The data points represent the mean for each 24‐month window of the x axis, and error bars represent the standard deviation. The blue line tracks a cumulative sum throughout the different 24‐month windows of the x axis, from baseline to 120 months. Data points represent the following number of patients: 0 to 24 months, N=12; 24 to 48 months, N=10; 48 to 72 months, N=24; 72 to 96 months, N=10; 96 to 120 months, N=10. A, Tortuosity index. B, Total absolute curvature. C, RMS curvature. RMS indicates root mean square; and SD, standard deviation.
