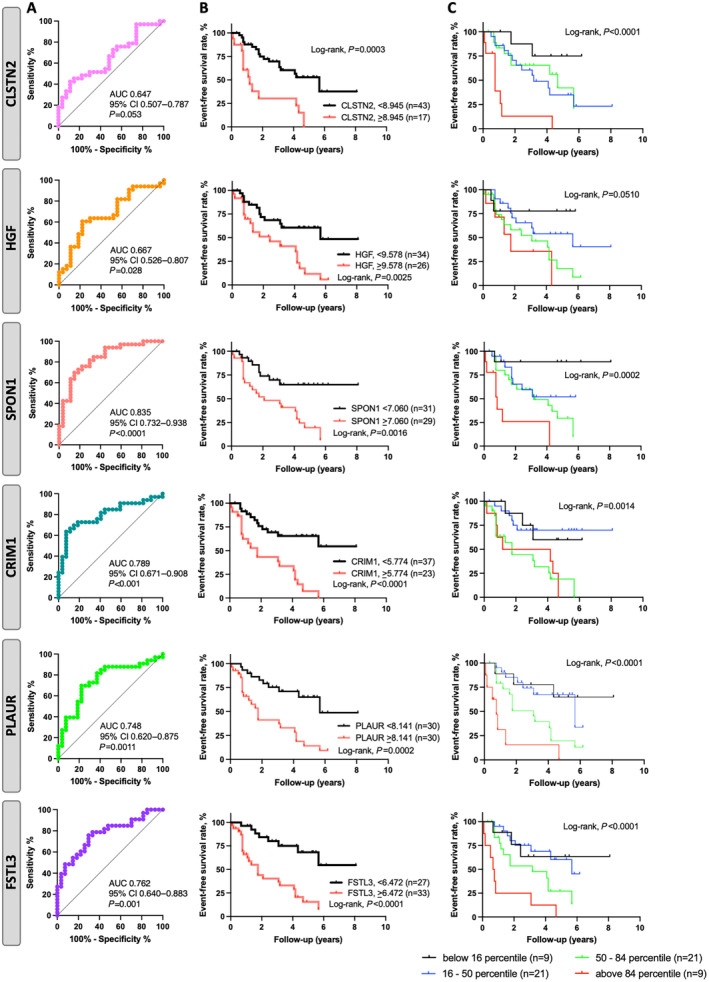
Figure 3. Survival ROC curves and Kaplan–Meier curves showing progression free survival in patients with PAH with baseline biomarker levels above or below the identified threshold.

A, ROC assessing the prognostic accuracy of CLSTN2, HGF, SPON1, CRIM1, PLAUR, and FSTL3. B, Kaplan–Meier survival curves according to ROC cutoff values for CLSTN2, HGF, SPON1, CRIM1, PLAUR, and FSTL3. C, Higher percentiles of the biomarker levels were also associated with lower event‐free survival, suggesting their ability to identify patients at high event risk. AUC indicates area under the curve. CLSTN2, calsyntenin 2; CRIM1, cysteine rich transmembrane bone morphogenetic protein regulator 1; FSTL3, follistatin‐like 3; HGF, hepatocyte growth factor; PAH, pulmonary arterial hypertension; PLAUR, plasminogen activator, urokinase receptor; ROC, receiver operating characteristics; and SPON1, spondin 1.
