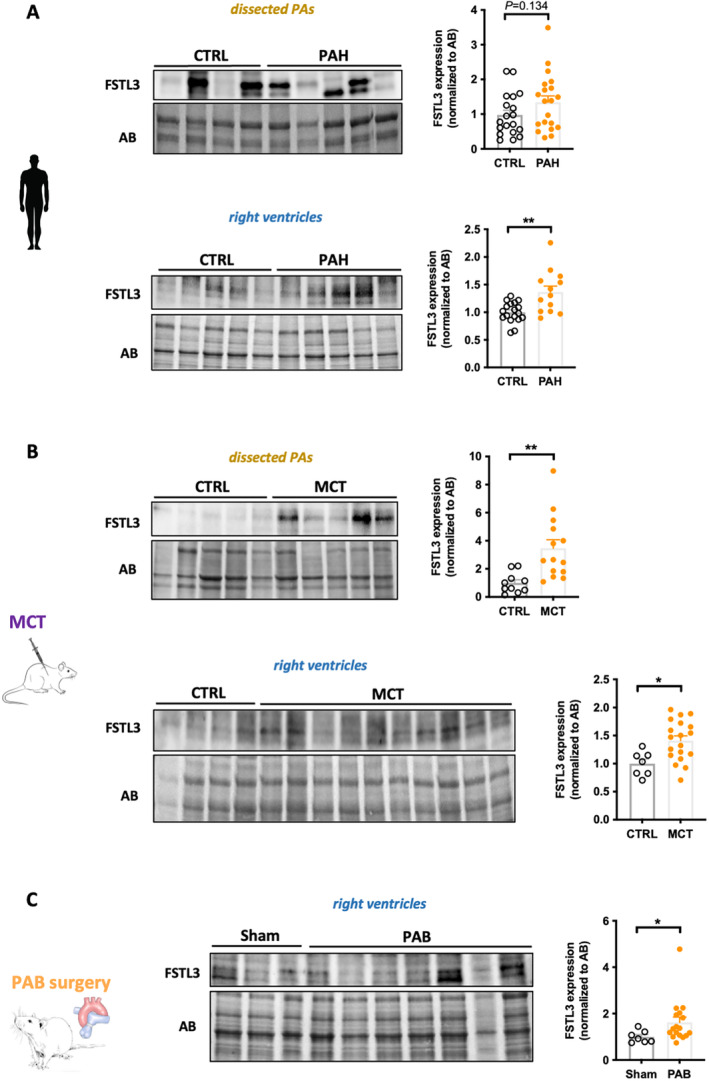
Figure 6. Upregulation of FSTL3 in remodeled RVs from patients with PAH and animal models.

A, Representative Western blots and corresponding quantifications of FSTL3 in dissected pulmonary arteries and RVs from CTRL (n=18–19) and patients with PAH (n=13–20). B, Representative Western blots and corresponding quantifications of FSTL3 in dissected PAs and RVs from CTRL (n=7–10) and monocrotaline‐injected (n=14–19) rats. C, Representative Western blot and corresponding quantification of FSTL3 in RVs from sham (n=7) and PAB‐subjected (n=17) rats. Protein expression was normalized to amido black. Scatter dot plots show individual values and mean±SEM. Statistical analyses were performed using Student's t test. *P<0.05 and **P<0.01. AB indicates amido black; CTRL, controls; FSTL3, follistatin‐like 3; MCT, monocrotaline; PA, pulmonary ateries; PAB, pulmonary artery banding; PAH, pulmonary arterial hypertension; and RV, right ventricle.
