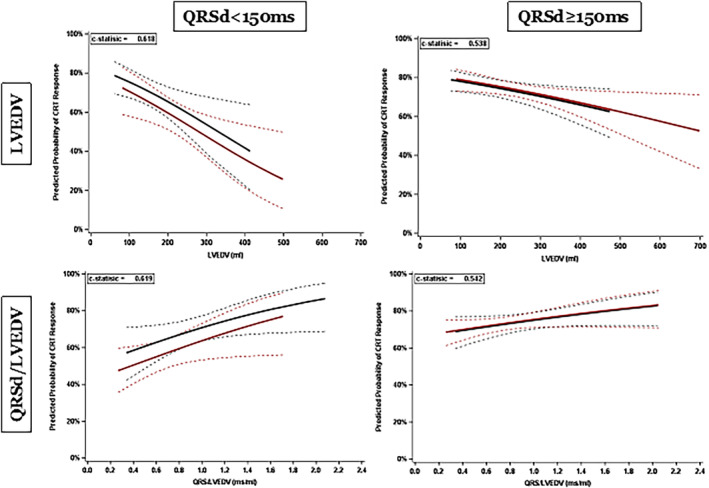
Figure 3. Parametric estimates with corresponding 95% CIs showing predicted CRT response as a function of LVEDV (top 2 parts) and normalized QRSd (bottom 2 parts).

The left parts display data for patients with QRSd <150 ms, and the right parts for those with QRSd >150 ms. Blue (with 95% CI): female patients, red (with 95% CI): male patients. CRT indicates cardiac resynchronization therapy; LVEDV, left ventricular end‐diastolic volume; and QRSd, QRS duration. The dashed lines represent the 95% CIs.
