FIGURE 2.

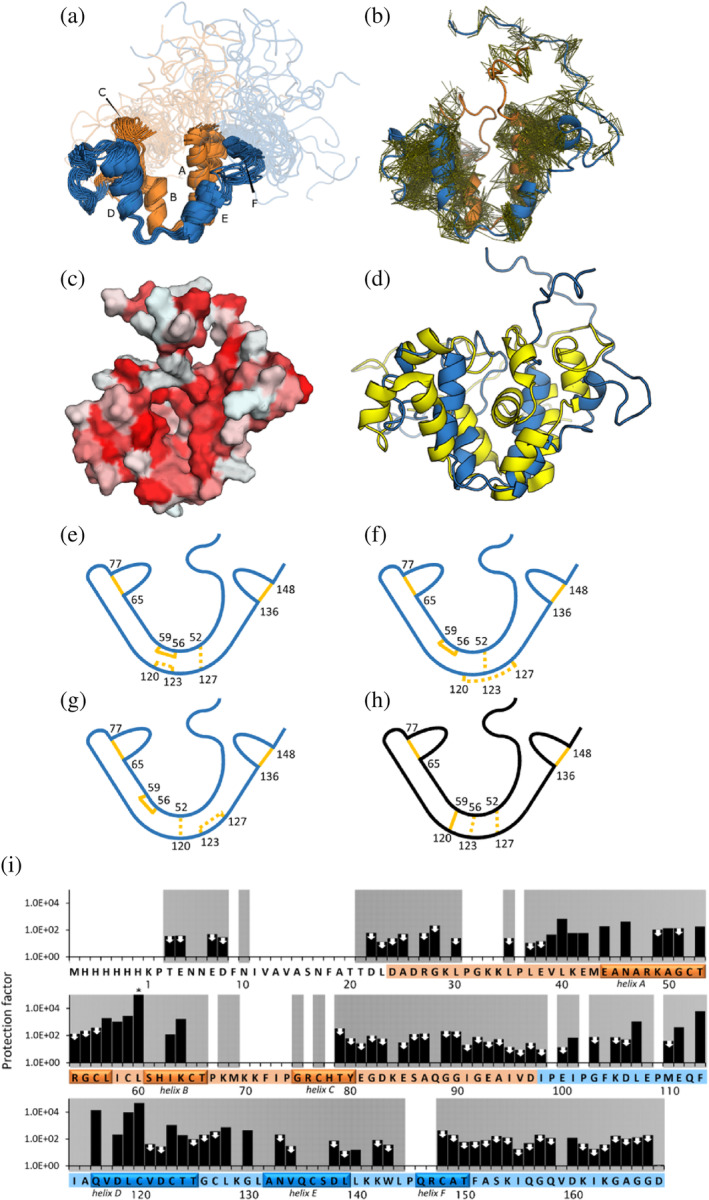
Structural properties of GLuc (a) ensemble of 20 representative structures of GLuc (PDB‐ID: 9FLA; BMRB‐ID: 34918). (b) Residues 1–97 are shown in orange, residues 98–168 are shown in blue, respectively corresponding repeated sequence motifs. Disordered parts are depicted semi‐transparently. Small capital letters indicate 6 α‐helixes. (b) Visualization of distance restraints used for the calculation of GLuc's structure. Each line represents a restraint between two atoms derived from an observed peak in a 3D NOESY spectrum. (c) Surface representation, where coloring indicates hydrophobicity, from least hydrophobic (white) to most hydrophobic (red) (Eisenberg et al., 1984). (d) Comparison of 9FLA (blue) and 7D2O (yellow; Wu et al., 2020) (e–g) Schematic representations of disulfide bond pattern between closely spaced cysteine residues. Bonds confirmed with high confidence by mass spectrometry are shown in solid lines. Three unresolved disulfide patterns are shown as dashed lines. Panel e represents the configuration we deem most likely based on MS/MS and structural restraints. (h) The disulfide bond configuration in 7D2O (Wu et al. (2020)) is not compatible with our data (Figure S11). (i) Hydrogen–deuterium‐exchange rates, determined by NMR. Protection factors were calculated as the ratio of the reference exchange rate in random coil to the measured exchange rate in GLuc's structure. Two mutually similar regions in the sequence are colored in orange and blue, respectively. White and gray background indicates absence or presence of backbone assignments, respectively. The helices are indicated on the sequence. White arrows mark 72 amides that had exchanged in the dead time, so only a maximum value of the protection factor could be estimated. The asterisk (*) indicates no change detected at the end of the experiment, meaning that the protection factor is likely higher than shown. See also Figure S12.
