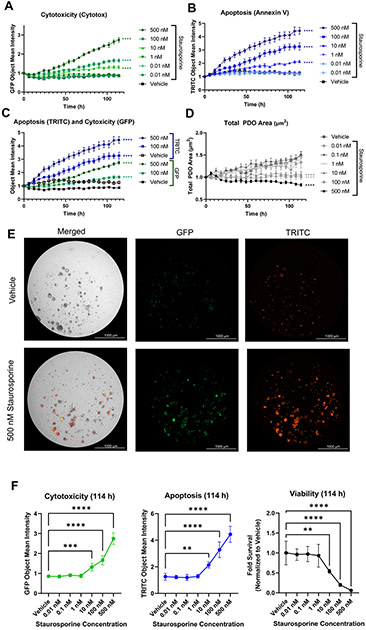
Figure 5: Multiplexed fluorescent live-cell imaging to assess PDO response.
PDO model ONC-10817 was plated in 96-well plates and incubated with Annexin V Red (1:400), and Cytotox Green (200 nM) dyes overnight at 37 °C. The following day, PDOs were treated with increasing concentrations of staurosporine and were imaged every 6 h for ~5 days. (A,B) Time and dose-dependent increase in (A) cytotoxicity or (B) apoptosis in response to staurosporine. Data were plotted as the Object Mean Intensity in the GFP or TRITC channel. (C) Comparison of the time course of apoptosis and cytotoxicity in response to 100 nM or 500 nM staurosporine. Data were plotted as the Object Mean Intensity values in the GFP and TRITC channels. (D) Staurosporine inhibits growth of PDOs. Data were plotted as the average total PDO area. Data in A-D were normalized to PDO number at time 0 h in each well and plotted as the mean and standard error of the mean (SEM). N=5 technical replicates per treatment. **** p < 0.0001 vs. vehicle control by 2-way ANOVA. (E) Representative bright field, GFP, and TRITC images of 500 nM staurosporine-treated PDOs vs. vehicle at the end of the experiment (114 h). Images were acquired with a 4x objective. (F) Quantification of cytotoxicity, apoptosis, and viability at the 114 h time point. GFP Object Mean Intensity (left) and TRITC Object Mean Intensity (middle) were calculated at the 114 h timepoint using results from panels A-C. Viability (right) was assessed using the CellTiter-Glo 3D reagent per the manufacturer's protocol. Raw luminescence (RLU) values were normalized to total PDO area at time 0 h and plotted as the fold viability relative to vehicle control, which was set at 1.0. ** p<0.01, ***p<0.001, **** p<0.0001 vs. vehicle control via one-way ANOVA with Dunnett's post-hoc test. N = 5 technical replicates per treatment.

