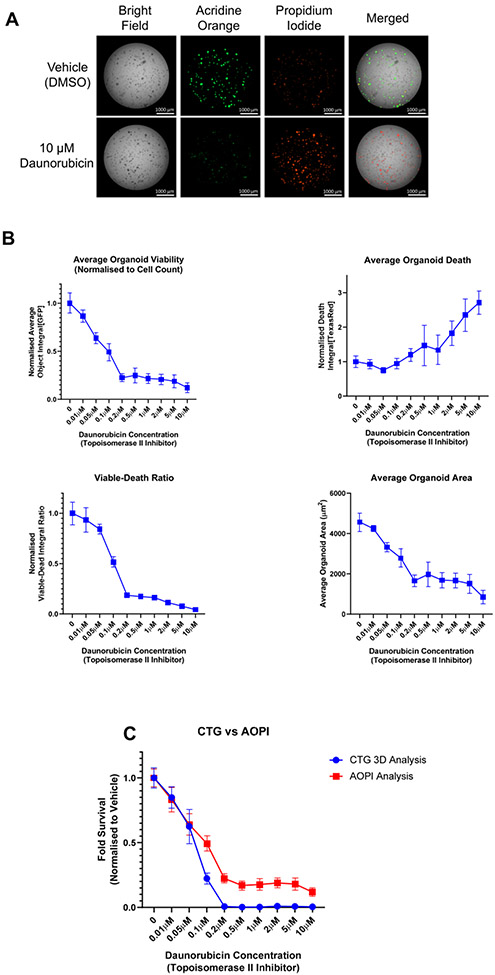
Figure 6: Use of live-cell imaging to aid in the normalization of endpoint assay data.
PDOs were treated with increasing concentrations of the topoisomerase-II inhibitor, daunorubicin, for 7 days. PDOs were exposed to AOPI Staining Solution and imaged as described in Supplementary File 1. AO = acridine orange, a measure of viability (GFP channel); PI = propidium iodide, a measure of cell death (Texas Red channel). (A) Representative images acquired using AOPI staining after 7 days of treatment with 10 μM daunorubicin or vehicle control (0.1% DMSO). (B) Different readouts using AOPI fluorescence as an endpoint viability/cell death method. See Supplementary File 1 for a detailed description of the analysis methods. Upper left, analysis of PDO viability after 7 days as determined by AO staining. Upper right, analysis of cell death by PI staining. Data for AO and PI staining were normalized to PDO number at time 0 h and then to vehicle control, which was set at 1.0, and plotted as the mean and standard deviation. Lower left, calculation of viable to dead ratio using the average object integrals for the AO and PI stains. Lower right, area of PDOs as determined by AO staining. Cellular Analysis was performed in the GFP channel. (C) Comparison of two methods to test PDO viability. After imaging, viability was evaluated using the CellTiter-Glo 3D reagent per the manufacturer's protocol. The fold survival relative to vehicle control was plotted at increasing concentrations of daunorubicin. Data represent the mean and standard deviation for N = 6 technical replicates per treatment; data were not normalized to time 0 h in panel C.

