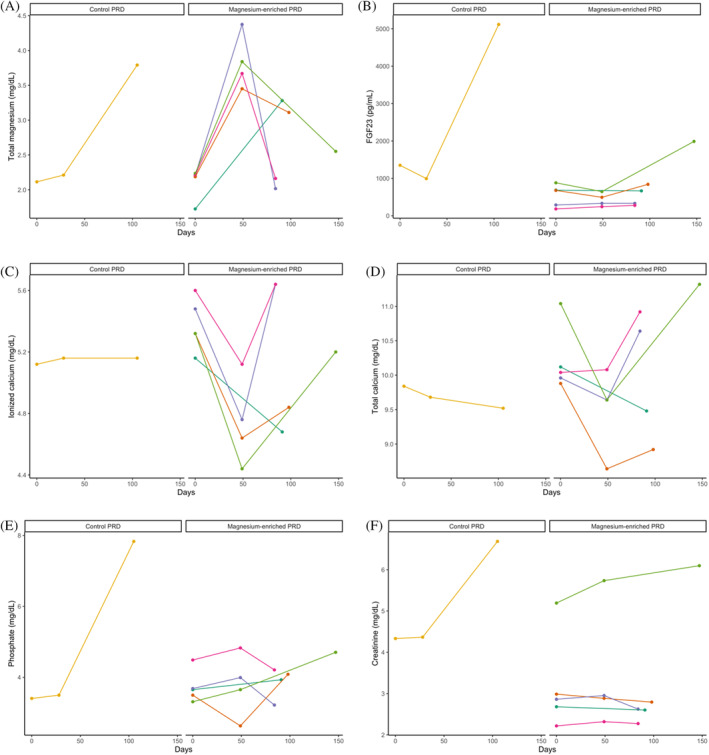
FIGURE 3.

Line graphs illustrating the change of plasma concentrations of (A) total magnesium (tMg); (B) fibroblast growth factor‐23 (FGF23); (C) ionized calcium (iCa); (D) total calcium (tCa); (E) phosphate; and (F) creatinine in individual cats with chronic kidney disease (CKD) that developed hypermagnesemia (n = 6) grouped according to allocation of trial diet (“control phosphate‐restricted diet [PRD]” vs “magnesium‐enriched PRD”) during the study period of this prospective diet trial (MAGMA).
