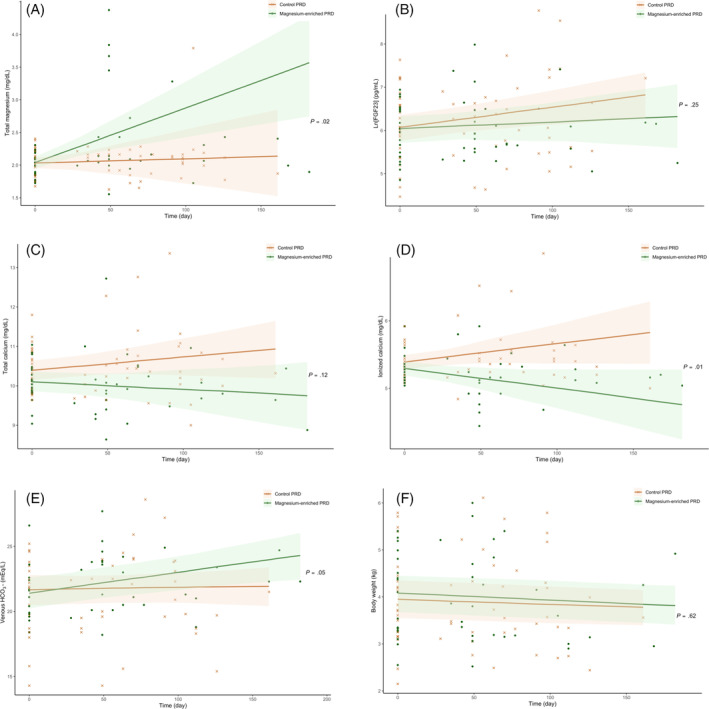
FIGURE 4.

Scatter plots illustrating the linear change of plasma concentrations of (A) total magnesium concentration (tMg); (B) log‐transformed fibroblast growth factor‐23 (ln[FGF23]); (C) total calcium (tCa); (D) ionized calcium (iCa); (E) venous bicarbonate (HCO3−); and (F) body weight in the per‐protocol cats (n = 44) according to the allocated trial diet (“control phosphate‐restricted diet [PRD]” [crosses] vs “magnesium‐enriched PRD” [dots]) during the study period. The P‐value refers to the Group × Time interaction (as shown in Table 6) analyzed using linear mixed effects models, which assessed the difference in rate of change of the outcome variable between groups (“control PRD” vs “magnesium‐enriched PRD”) over time.
