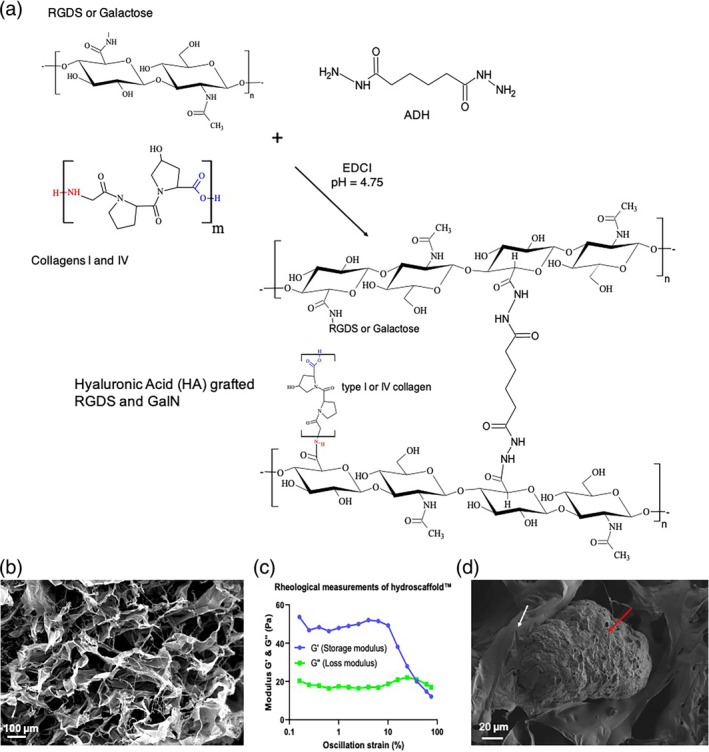
FIGURE 1.

A 3D environment for hiPSC differentiation into liver organoids. (a) Step and formulation for Hydroscaffolds™ production. (b) Scanning electron microscopy (SEM) observations of the dehydrated scaffold; scale bar = 100 μm. (c) Rheological measurements of HA‐g‐RGDS and type I and IV collagens: storage modulus (G') (blue) and loss modulus (G″) (green); T = 37°C, frequency = 1 Hz. (d) SEM observations of the dehydrated scaffold (white arrow) in culture with liver organoid (red arrow); scale bar = 20 μm.
