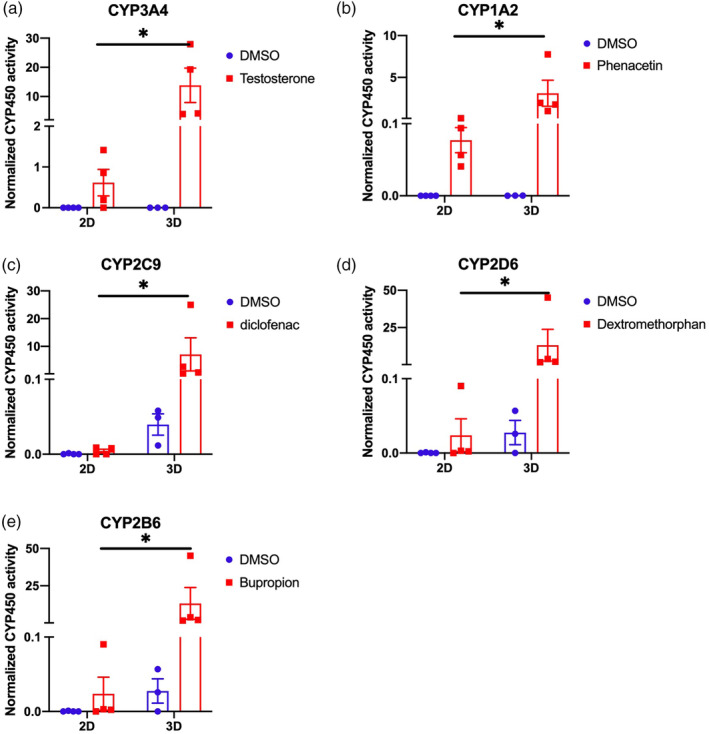
FIGURE 6.

CYP450 activity in hepatocyte‐like cells (HLCs) (2D) and liver organoids (3D) measured in basal conditions and after induction with either DMSO (vehicle control), testosterone (CYP3A4) (a), phenacetin (CYP1A2) (b), diclofenac (CYP2C9) (c), dextromethorphan (CYP2D6) (d), and bupropion (CYP2B6) (e) treatments. Values are normalized against total RNA content (n = 4 independent differentiations). Statistical significance was assessed using unpaired t test, with a p value cut‐off set at p < 0.05. *, p value <0.05; **, p value <0.01; ***, p value <0.001; ns, not significant.
