FIGURE 7.

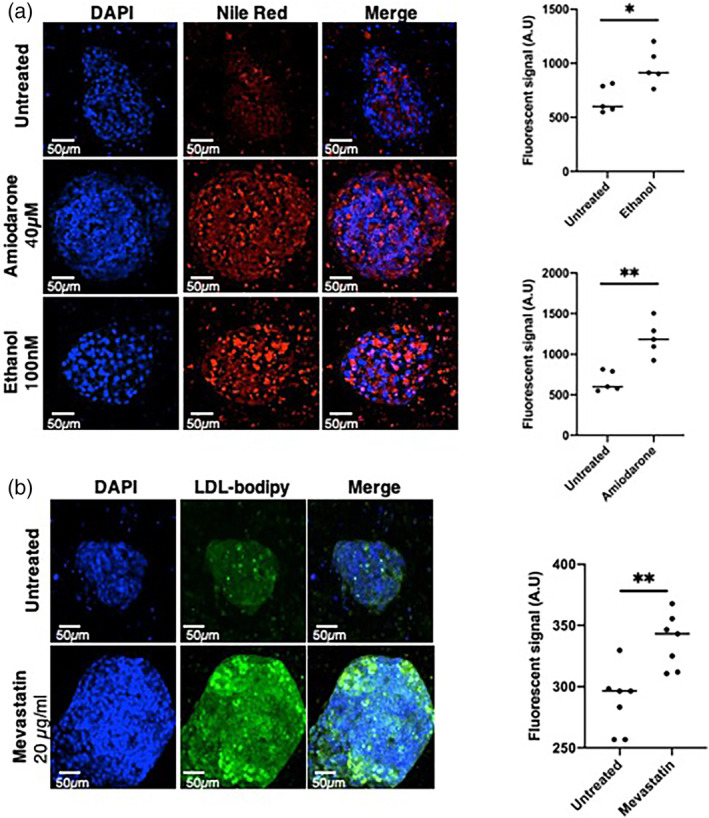
Lipid metabolism in liver organoids. (a) Left panel, liver organoids stained with DAPI (blue, nuclei) and Nile red (red, lipid droplets) in untreated conditions, and upon amiodarone (40 μM) or ethanol (200 nM) 24 h treatments. Right panel, fluorescence quantification (N = 5). (b) Left panel; liver organoids incubated with LDL‐bodipy (green) in untreated condition and upon mevastatin treatment. Nuclei were stained with DAPI (blue). Right panel, fluorescence quantification (N = 7). Statistical significance was assessed using unpaired t test, with a p value cut‐off set at p < 0.05. *, p value <0.05; **, p value <0.01; ***, p value <0.001; ns, not significant.
