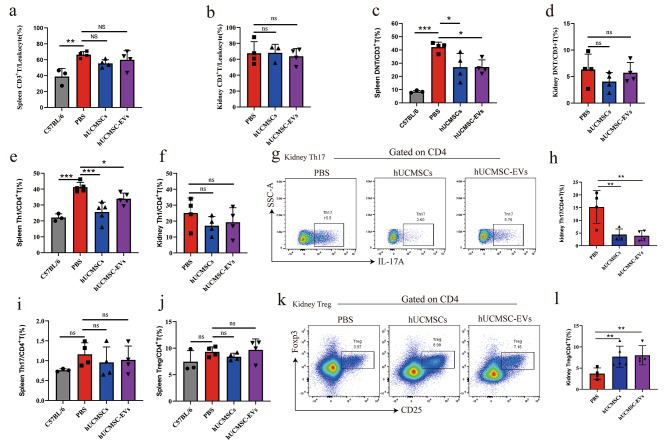
Fig. 3.
Flow cytometry analyses of T cells among the splenocytes and KITs of MRL/lpr mice after hUCMSC-EVs treatment. (a, c, e, i, j) Percentages of CD3+ T cell, Th1 cell, Th17 cell, and Treg cell among splenocytes of normal mice or MRL/lpr mice treated by PBS, hUCMSCs, or hUCMSC-EVs. (b, d, f, h, l) Percentages of CD3+ T cells, Th1 cells, Th17 cells, and Treg cells among the KITs of MRL/lpr mice treated by PBS, hUCMSCs, or hUCMSC-EVs. (g, k) Representative flow cytometry analyses images of CD4+IL17+ (Th17) cells and CD4+CD25+Foxp3+ (Treg) cells among the KITs. Data are expressed as mean ± SD, *p < 0.05, **p < 0.01, *** p < 0.001 vs. the PBS group

