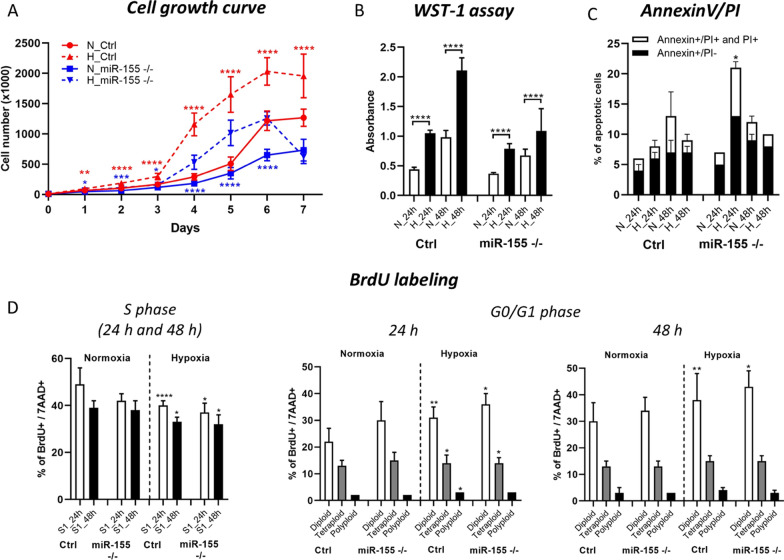
Fig. 2.
Proliferation and cell viability of MEC-1 cells during hypoxia. A The cell growth curve of MEC-1 cells (ctrl and miR-155–/–) in normoxia (N) vs hypoxia (H). Cells were counted within 7 days in hemocytometer chamber. For statistics we compared cell numbers in MEC-1 control cells in normoxia vs in hypoxia and the same for miR-155 deficient MEC-1 cell line. B Cell viability was measured by WST-1 assay in both normoxia vs hypoxia in 24 h and 48 h time periods. C Percentage of apoptotic cells measured by flow cytometry after Annexin V/PI staining. Cells were stained in parallel in normoxia and hypoxia conditions in 24 h and 48 h time periods. D Detection of the cell cycle kinetics by BrdU labelling in normoxia vs hypoxia in 24 h and 48 h. Left graph shows percentage of BrdU/7AAD positive cells. Right graphs depict cell population in G0/G1 phase. Representative picture of dot plot is in Supplemental Figure 3. For statistics we compared percentage (populations) of MEC-1 control cells in normoxic vs MEC-1 control cells in the hypoxic conditions (the same for miR-155 deficient MEC-1 cells). All values are means ± standard deviation obtained from three independent experiments. Statistics: t-test, two tailed, paired was used (*p<0.05; **p<0.01; ***p<0.001; ****p<0.0001). Additionally, we conducted the statistical analysis of MEC-1 ctrl cells vs miR-155–/– in normoxia and so on in the hypoxia for the whole Figure 2. The statistical significance is shown in the Supplemental Material/Tables.

