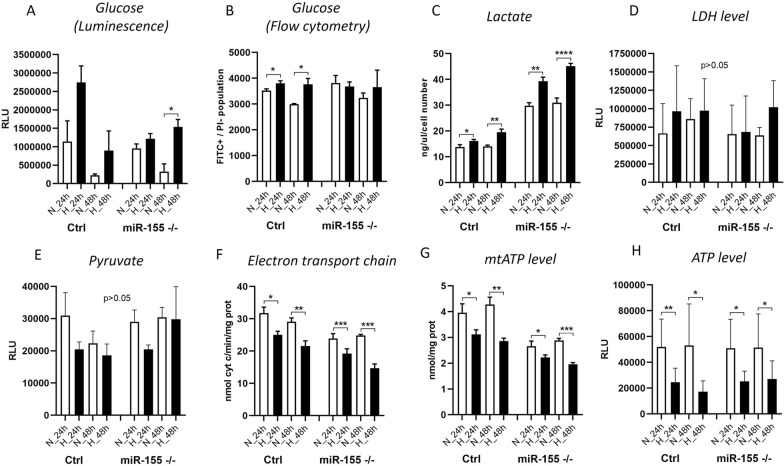
Fig. 4.
Measurement of metabolism in MEC-1 cells in normoxia and hypoxia. For the assessment of glucose uptake in MEC-1 cells (control (ctrl) and miR-155 –/–) in normoxia vs hypoxia we used A Glucose Uptake-GloTM Assay and B 2-NBDG fluorescent molecule. C Shows the concentration of Lactate measured by colorimetric assay. D LDH level was measurement by LDH-Glo™ Cytotoxicity Assay. E Pyruvate concentration was measured by Pyruvate Assay Kit. F The electron transport chain form complex I to complex III (ETC) was measured by following the protocol in [20]. G mtATP level was measured by Adenosine 5′-triphosphate (ATP) Bioluminescent Assay Kit. H ATP level was measured by CellTiter-Glo® 2.0 Cell Viability Assay. All values are means ± standard deviation obtained from three independent experiments. Statistics t-test, two-tailed, paired was used, (*p < 0.05; **p < 0.01; ***p < 0.001; ****p < 0.0001)

