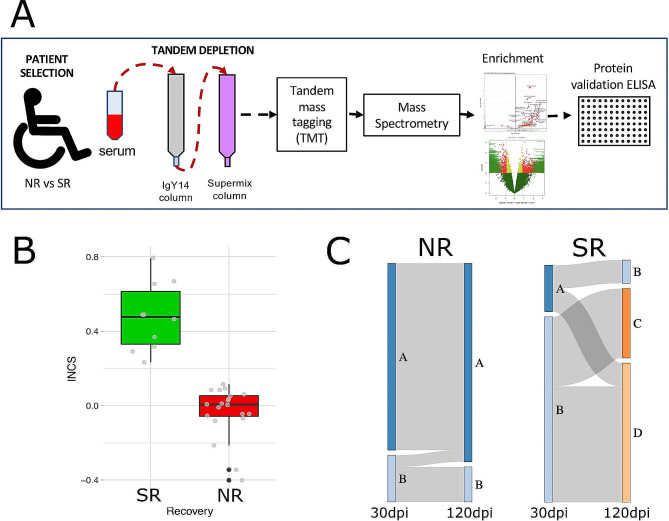
Fig. 1.
Experimental Design. (A) Scheme depicting the workflow used in this study. Sera were collected from SCI patients with no (NR) or strong (SR) recovery and depleted from high and medium abundant proteins for subsequent tagging and detection of low abundant proteins using mass spectrometry. After enrichment analysis (NR vs. SR), some of these proteins were further validated by ELISA. (B) Box plot showing the distribution of SR (green) and NR (red) patients studied according to their Integrated Neurological Change Score (INCS) between 30 and 120 days after injury. (C) Distribution of SR (green) and NR (red) patients according to their AIS grade conversion (-1 to + 3) between 30 and 120 days after injury

