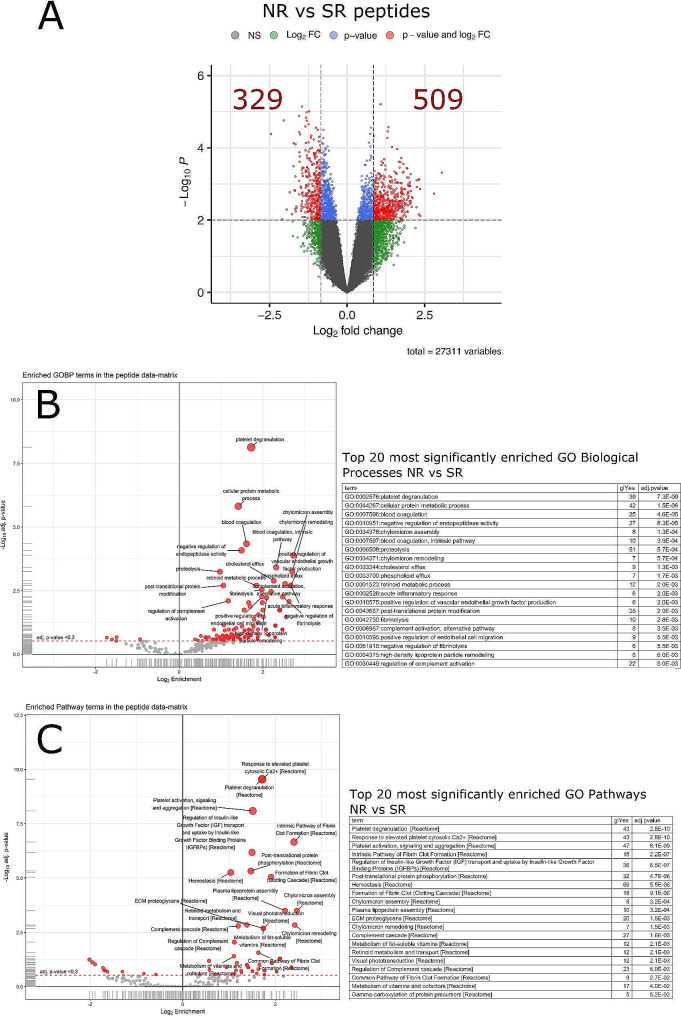
Fig. 2.
Analysis of peptides with differential expression between patients with no (NR) or strong (SR) recovery. (A) Volcano plot for data comparisons at peptide level. The plot shows features log2 FC values (x-axis) and log10 p-values (y-axis). The thresholds applied (dashed lines) are alpha = 0.01 and FCT = 1.8. Spots in red indicate peptides that fulfil the p-value and FC threshold criteria (quantity shown in red numbers). Blue spots highlight significant peptides (p-value < = alpha) that fall below the FC threshold. Green spots represent peptides with statistical significance but below FC threshold criteria and grey spots those that did not meet any significance criteria. (B, C) Functional analysis using enriched peptides. Volcano plots and extracts of the enriched tables based on regulated peptides are shown for (B) Gene Ontology Biological Processes (GO_BPs) and (C) Pathways. For each analysis, red filled circles indicate terms found to be over-represented in the data set. Tables with top 20 enriched terms are reported for each comparison where the terms are sorted by the adj-p-values

