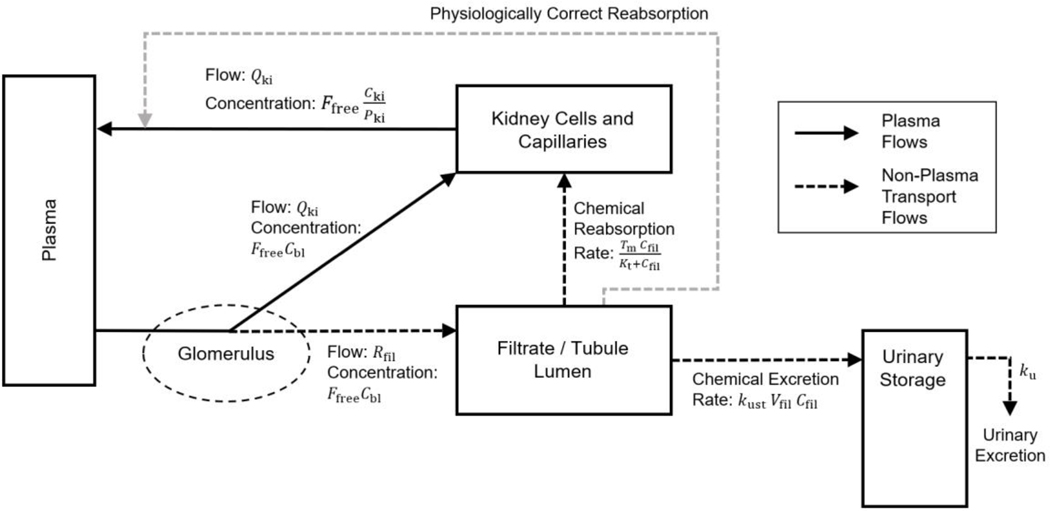
Figure 12.
A schematic diagram depicting flows of material through the kidney. This schematic compares what is implemented in the model template (shown by the darker arrows) with a more accurate description of the physiology (shown by the lighter arrows). Chemical in the plasma compartment passes through the glomerulus which filters out water and other substances into the tubule lumen with a flow rate while the remaining blood plasma flows to the kidney cells and capillaries at blood flow rate . From the tubule lumen, the filtrate can be reabsorbed by a saturable process with maximum transport rate and affinity constant or eliminated to the urinary storage compartment by a first-order process with a rate constant . In the model template, this reabsorbed chemical is added to the amount in the kidney cells and capillaries compartment, as shown by the darker dashed arrow. A more biologically accurate description would have this reabsorbed chemical flow into venous capillaries not the kidney cells, as shown by the lighter dashed arrow from the filtrate/tubular lumen to the solid arrow representing blood plasma leaving the kidney cells and capillaries.

