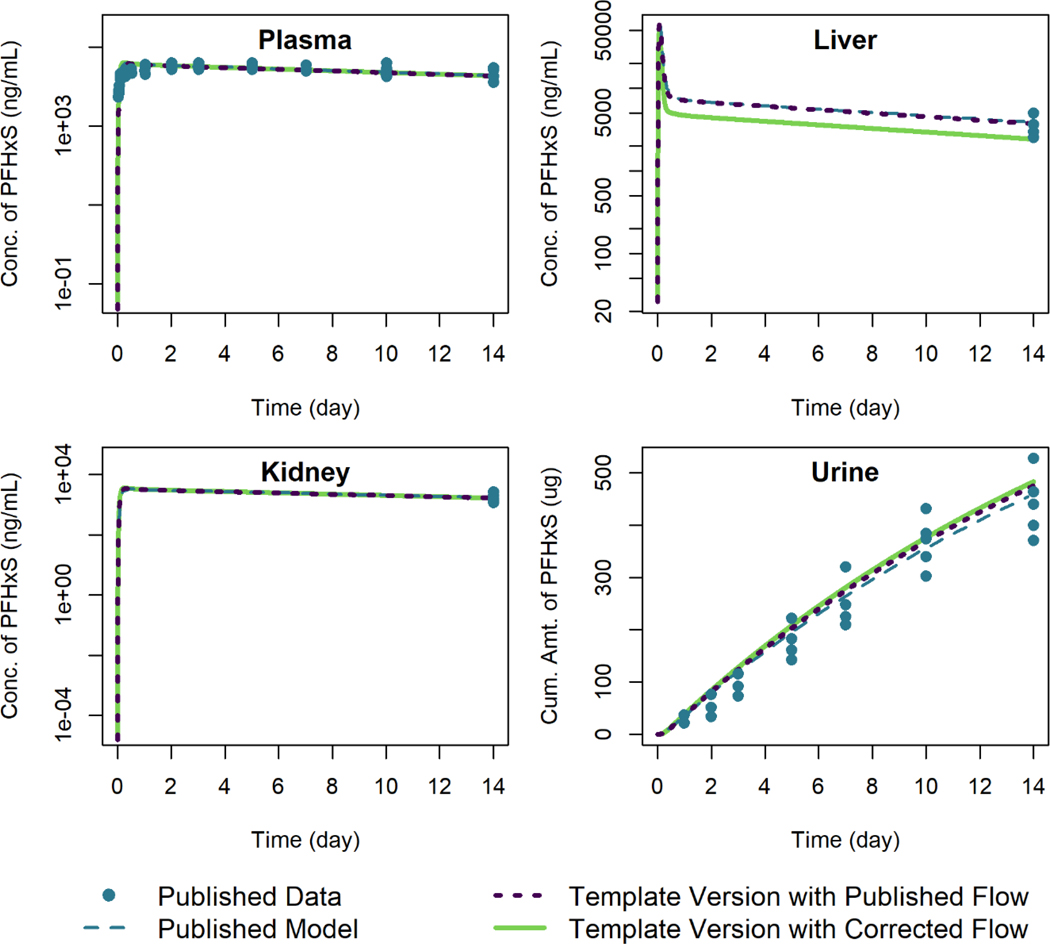
Figure 4.
Comparison of published model simulations (dashed lines) and template version of the model simulations (solid and dotted lines) for the concentration of PFHxS in plasma, liver, and kidney, and the amount of PFHxS in urine for male rats given a single oral dose of 10 mg/kg of PFHxS. Published model simulations and published data (points) were digitized from Figures 7a, 7b, 7c, and 7f of Kim et al. (2018). Model parameters were not recalibrated for the template version of the model with the corrected flow in order to fit the published data.

