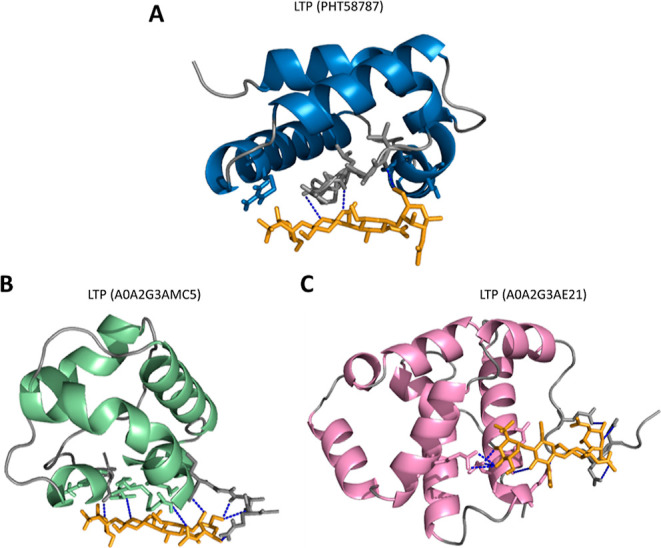
Figure 5.

Three-dimensional structure of the LTP protein interacting with (NAG)4. A: LTP with similarity to Cb-F2, C. baccatum, accession: PHT58787. Alpha helices are represented in blue; loop regions are represented in gray. B: LTP with similarity to Cf-F2, C. frutescens, accession: A0A2G3AMC5. Alpha helices are represented in green; loop regions are represented in gray. C: LTP with similarity to Cf-F2, C. frutescens, accession: A0A2G3AE21. Alpha helices are represented in pink; loop regions are represented in gray. The NAG tetramer is represented in orange. Dashed blue lines = hydrogen bonds.
