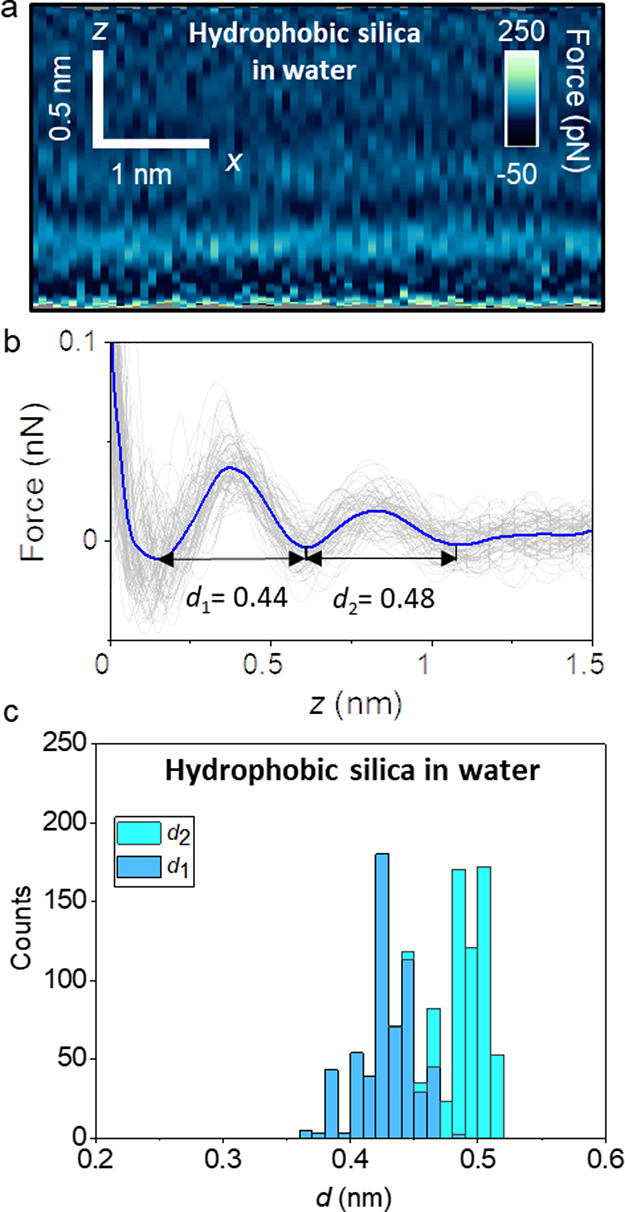
Figure 2.

Interfacial liquid water structure on a hydrophobic silica surface (OTS). (a) 2D force maps (x, z) of an OTS–water interface (1 mM KCl). (b) Force–distance curves obtained from (a). (c) Histogram of d1 and d2 distances measured from several hydrophobic silica–water interfaces. About 600 force–distance curves are used to plot the histogram. The average force–distance curve is highlighted in blue. Individual force–distance curves are plotted in gray. Experimental parameters: f = 806 kHz, k = 9.2 N m–1, Q = 6.3, A0 = 150, and Asp = 100 pm.
