
Figure 4.
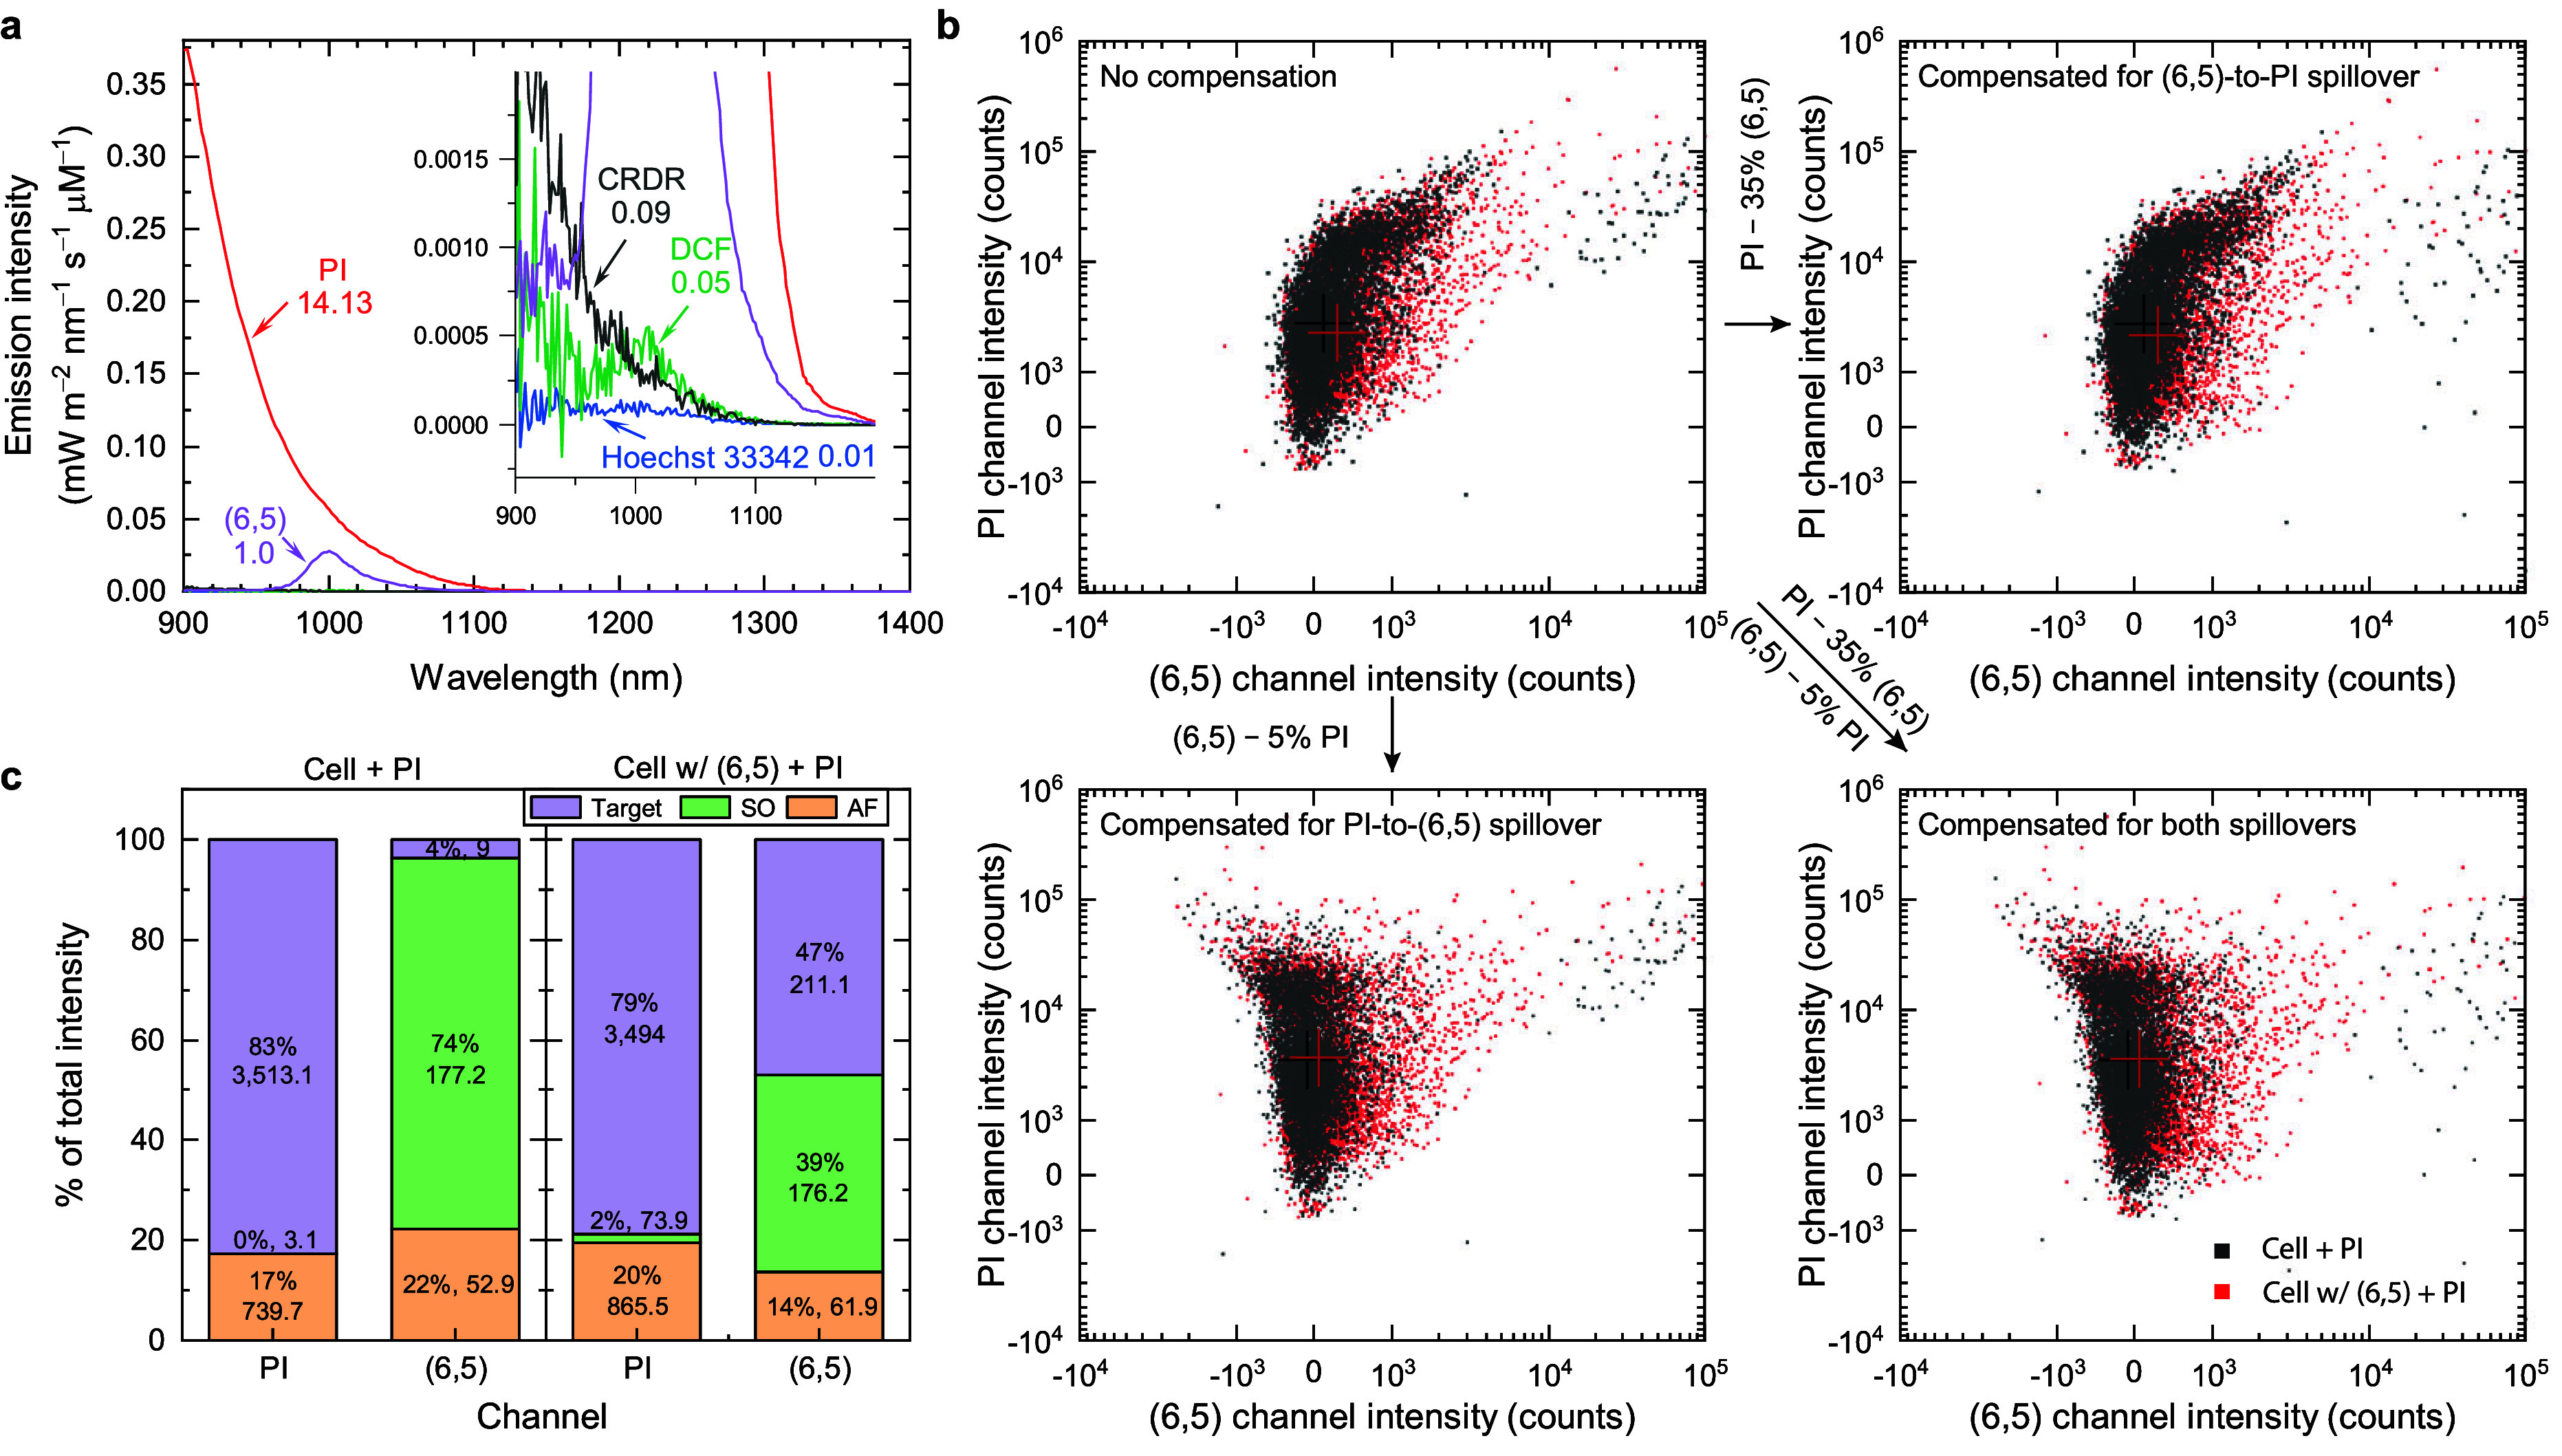
Fluorescence spillover between (6,5) and several other commonly used visible fluorophores for flow cytometric measurements. (a) SWIR fluorescence spectra of (6,5), PI, CRDR, DCF, and Hoechst 33342. The emission intensity is normalized to molar concentration of the fluorophores and multiplied by the detector spectral efficiency. A 50-carbon (6,5) is assumed to reach similar molecular weight compared to other fluorophores. Inset zooms in the figure for visualizing the spectra of CRDR, DCF and Hoechst 33342. The relative integrated molar emission intensity normalized to that of (6,5) in the range of 900–1100 nm are labeled below the fluorophore names. (b) Spillover compensations between PI and (6,5) channels. The crosses in the figure represent the median intensities of PI and (6,5) channel intensities. Approximately 170,000 cells are presented. (c) Deduced intensity distributions among target fluorescent signals (purple), spillover signals (green), and autofluorescence background (orange). The cellular (6,5) mass is ∼17.7 fg cell–1 in this case.