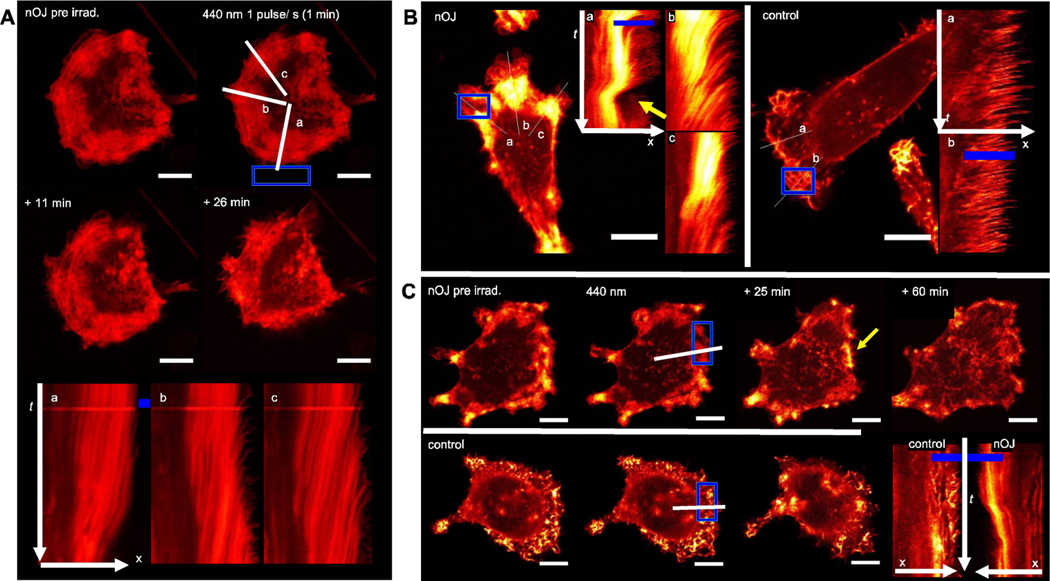
Figure 5.
Live-cell imaging under local activation of nOJ. A) A small region (ROI, blue) outside of the MDA-MB-231 mCherry:LifeAct cell was irradiated with 440 nm pulses (1 min, ca. 1 pulse/s) lines and a/b/c indicate axes represented in kymographs. B) in the presence of nOJ, MDA-MB-231 mCherry:LifeAct cells react strongly to ROI with 440 nm light pulses (1 puls/sec.): control: no change in actin dynamics. C) MDA-MB-231 mCherry:LifeAct cells with irradiation in the lamellipodium. Top row in presence of nOJ, bottom row control (cosolvent). Bottom right: direct comparison of kymographs of treated and untreated cell; all scale bars: 10 μm; C–E: confocal microscope, 63×objective. mCherry:LifeAct signal graded from red (lower intensity) to yellow (high intensity), intensities between images/cells are not comparable (expression level differences)

