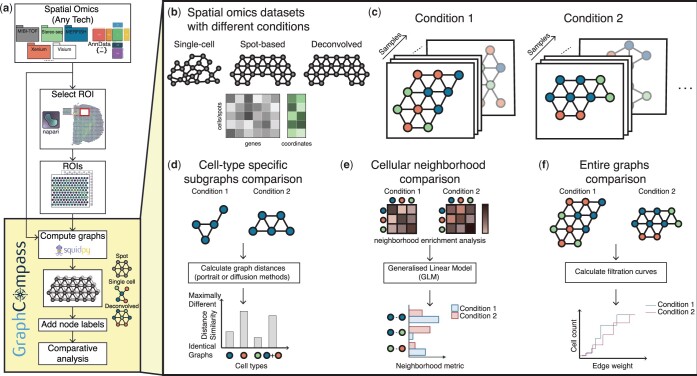
Figure 1.
GraphCompass offers graph and statistical analysis methods to compare the spatial organization of cells across different conditions. (a) GraphCompass workflow. All spatial omics datasets that are stored as AnnData objects are currently supported. Support for SpatialData objects (Marconato et al. 2024) will be added in the near future. Select a region of interest (ROI) with napari (https://github.com/napari/napari) or use the entire tissue section. We use Squidpy to encode spatial omics measurements as graphs. If available, add node labels, such as cell types. Then, compare graphs across conditions or samples using any of the methods implemented in GraphCompass. (b) The example datasets covered here represent various technologies and different modalities. (c) In our framework, samples are represented as cellular graphs in which nodes correspond to cells or spots and edges denote spatial proximity. Nodes may be labeled (colored) based on their cell type and samples representing the same condition are grouped together to account for sample variation. (d–f) GraphCompass integrates multiple spatial metrics to find statistically significant differences in spatial organization across experimental conditions, utilizing spatial information at various abstraction levels. (d) Analyse graphs that consist of a single cell type and compare them between conditions using graph distance metrics (cell-type-specific subgraphs comparison). (e) Perform neighborhood analysis by retrieving cell-type neighbors enriched in one condition compared to another (cellular neighborhood comparison). (f) Using a holistic approach, compare entire graphs representing data obtained under two or more conditions (entire graphs comparison).

