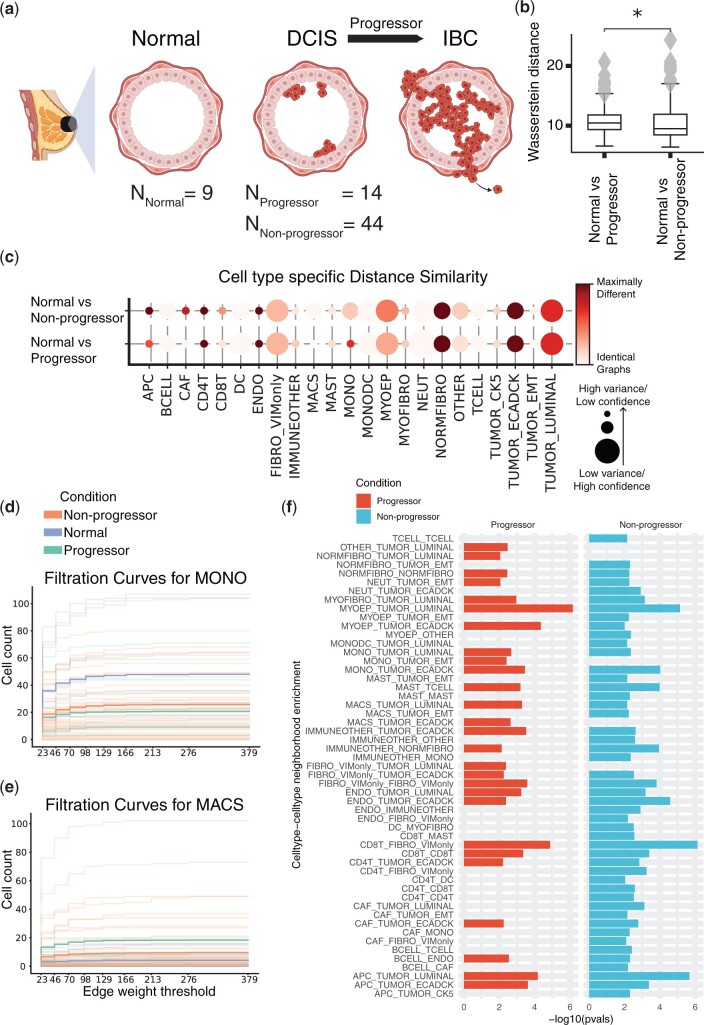
Figure 2.
MIBI-TOF dataset studying the role of the tumor microenvironment (TME) in breast cancer progression. (a) Schematic figure describing the different biological conditions investigated in this study. (b) Comparing entire tissue samples, using Weisfeiler–Lehman Graph Kernels, to show the overall similarity in spatial organization across two conditions (normal versus non-progressors and normal versus progressors). The smaller the Wasserstein distance, the more similar the spatial organization is under the two compared conditions. (c) Cell-type-specific subgraphs comparison, using the portrait method, across condition pairs (normal versus non-progressors and normal versus progressors). The size of the dot is indicative of the dissimilarity score variance over samples. The larger the dot size, the lower the score variance and the higher the score confidence is. (d, e) Filtration curves (Normal, Non-progressor, and Progressor) for (d) Monocytes and (e) Macrophages. We plot a filtration curve for every sample, as well as the mean curve for every condition, which can be identified by the thicker, darker lines. Large vertical steps towards the left of the plot indicate high density, whereas large vertical steps towards the right of the plot indicate low density. (f) Enrichment of various cell type pairs in progressors and non-progressors, where the control condition acts as a baseline.

