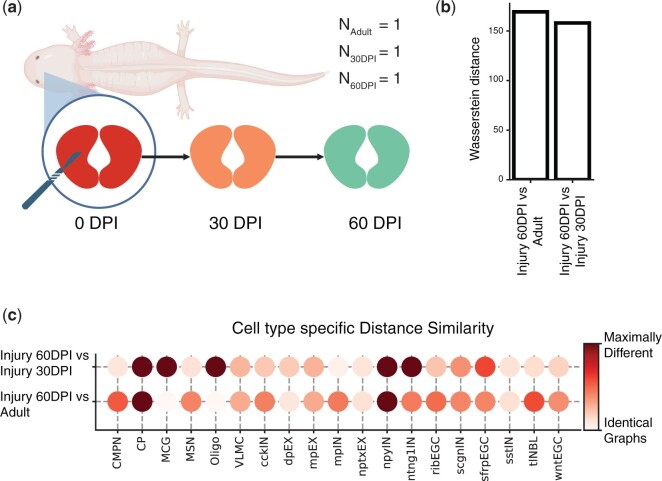
Figure 4.
Stereo-seq dataset studying the axolotl brain during development and regeneration. (a) Schematic figure describing the subset of regeneration stages we investigated. On the day of injury (0 days post-injury, DPI), a section of the brain was removed. We compared a tissue sample collected 30 days post-injury (30 DPI) with a section obtained 60 days post-injury (60 DPI) and a control sample from an unharmed adult axolotl. (b) Comparing entire tissue samples, using Weisfeiler–Lehman Graph Kernels, to show the overall similarity in spatial organization across two stages (Injury 60 DPI versus Adult and Injury 60 DPI versus Injury 30 DPI). The smaller the Wasserstein distance, the more similar the spatial organization is under the two compared conditions. (c) Cell-type-specific subgraphs comparison, using the portrait method, across condition pairs (Injury 60 DPI versus Adult, Injury 60 DPI versus Injury 30 DPI).

