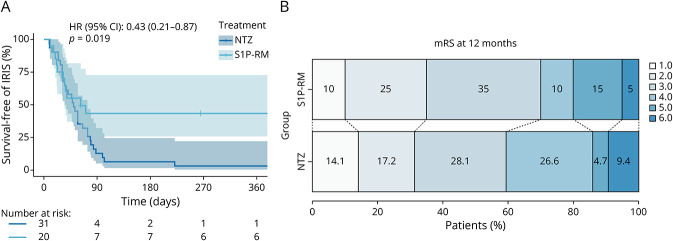
Figure 2. Outcome in S1P-RM and Natalizumab-Associated PML.
(A) Kaplan-Meier curve of incidence of IRIS over time. HR was obtained through a Cox regression model. (B) Graphical representation of mRS at 12 months (or the last follow-up if ≤12 months). HR = hazard ratio; NTZ = natalizumab; S1P-RM = sphingosine-1-phosphate receptor modulators.

