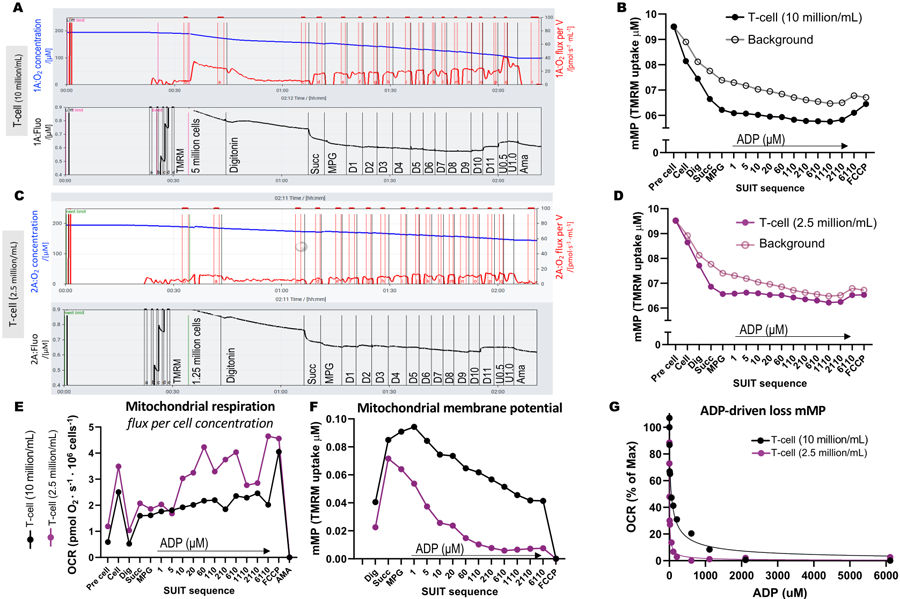
Figure 3: High-resolution fluorespirometry experiments.

(A-D) Trace of high-resolution fluorespirometry experiments using T-cell concentrations of 10 million cells/mL and 2.5 million cells/mL in 0.5 mL chambers. (A) 10 million cells/mL in 0.5 mL chambers. (C) 2.5 million cells/mL in 0.5 mL chambers. Oxygen flux (pmol/s/mL) is shown in the top panel (red), and the calibrated TMRM signal is shown in the bottom panel (black). Changes in TMRM throughout the SUIT for the sample and its calculated background were plotted for the chambers containing (B) 10 million cells/mL and (D) 2.5 million cells/mL. (E) For each cell concentration, oxygen flux (pmol/s/million cells) and (F) mitochondrial membrane potential were calculated. (G) ADP sensitivity curve was plotted and fit to a non-linear regression model (solid lines). Abbreviations: mMP, mitochondrial membrane potential; TMRM, tetramethylrhodamine methyl ester; SUIT, substrate-uncoupler-inhibitor titrations; ADP, adenosine diphosphate; Dig, digitonin; Mal, malate; Pyr, pyruvate; Glut, glutamate; D1–11, 11 consecutive ADP titrations; U, uncoupler FCCP of 0.5 and 1.0 μM; AMA, antimycin A.
