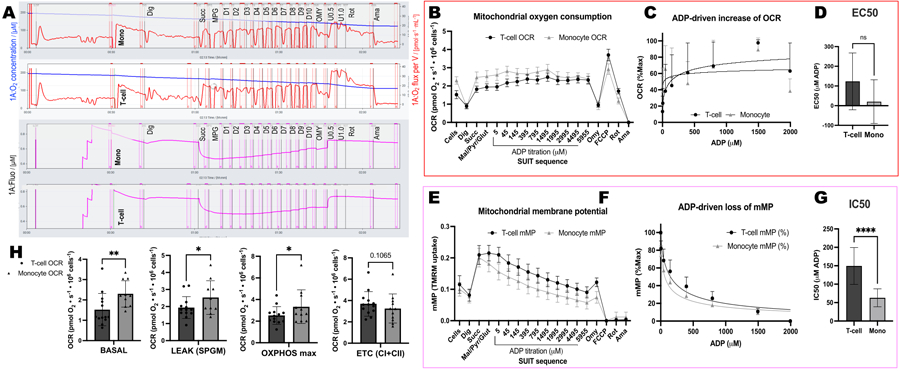
Figure 6: Differences in ADP sensitivity between T-cells and monocytes using OCR and mMP.

(A) Trace of high-resolution fluorespirometry experiment from a subjecťs monocyte and T-cell sample. (B) Oxygen consumption in monocytes (n= 11) and T-cells (n= 13) from the blood of healthy volunteers. (C,D) Non-linear regression fitting of the plotted rise in respiration with ADP titrations to calculate an EC50. (E) Simultaneous measurement of mitochondrial membrane potential. (F,G) Non-linear regression fitting of the plotted decline in mitochondrial membrane potential with ADP titrations to calculate an IC50. (H) Parameters of respiratory capacity of monocytes and T-cells. Data are expressed as mean ± SEM for line graphs and mean ± SD for bar graphs. Statistically significant differences following t-tests are expressed as *p < 0.05. **p < 0.01, and ****p < for 0.0001.
