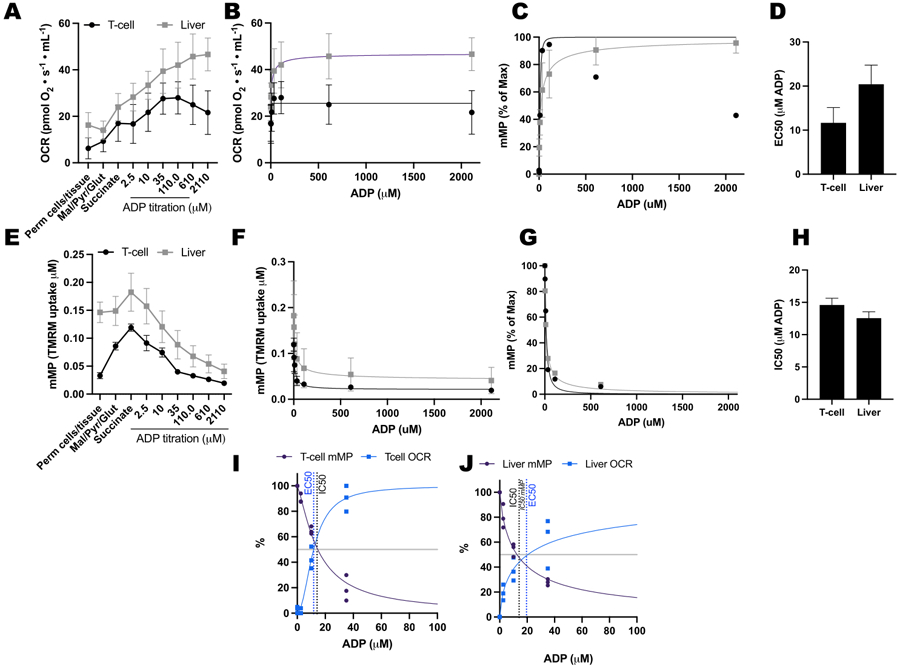
Figure 7: Comparing ADP response in respiration and mitochondrial membrane potential (mMP) in permeabilized mouse splenic T-cells and liver.

(A-D) Response in respiration in permeabilized mouse splenic T-cells and liver. (E-H) Response in mMP in permeabilized mouse splenic T-cells and liver. Fresh liver and spleen were dissected from three mice following cervical dislocation. Splenic Pan T-cells were isolated using antibody-conjugated magnetic bead separation. Both samples underwent the same SUIT protocol in the presence of 1 μM TMRM. (I,J) Comparison of EC50 calculated from the increase in oxygen consumption (OCR) and IC50 from the decrease in mMP in response to ADP. N = 3 per group. Data are expressed as mean ± SEM.
